| Param | Original file | Final file |
|---|---|---|
| Filename | modeM0/AS1T04_086T01_9000004890cztM0_level2_bc.evt | modeM0/AS1T04_086T01_9000004890cztM0_level2_quad_clean.evt |
| Size (bytes) | 6,249,490,560 | 1,545,312,960 |
| Size | 5.8 GB | 1.4 GB |
| Events in quadrant A | 25,726,666 | 9,801,914 |
| Events in quadrant B | 42,810,068 | 9,750,175 |
| Events in quadrant C | 34,723,587 | 9,986,913 |
| Events in quadrant D | 77,849,927 | 9,030,665 |
| Mode M0 | |||
|---|---|---|---|
| Quadrant | BADHDUFLAG | Total packets | Discarded packets |
| A | 0 | 245301 | 0 |
| B | 0 | 312584 | 0 |
| C | 0 | 264791 | 0 |
| D | 0 | 417666 | 0 |
| Mode SS | |||
|---|---|---|---|
| Quadrant | BADHDUFLAG | Total packets | Discarded packets |
| A | 0 | 2452 | 0 |
| B | 0 | 2452 | 0 |
| C | 0 | 2452 | 0 |
| D | 0 | 2452 | 0 |
| Mode M9 | |||
|---|---|---|---|
| Quadrant | BADHDUFLAG | Total packets | Discarded packets |
| A | 0 | 462 | 0 |
| B | 0 | 462 | 0 |
| C | 0 | 462 | 0 |
| D | 0 | 462 | 0 |
| Quadrant | Total seconds | Saturated seconds | Saturation percentage |
|---|---|---|---|
| A | 120192 | 214 | 0.178048% |
| B | 120192 | 5431 | 4.518604% |
| C | 120192 | 1317 | 1.095747% |
| D | 120192 | 8937 | 7.435603% |
Noise dominated data is calculated using 1-second bins in cleaned event files. If a bin has >2000 counts, and if more than 50% of those come from <1% of pixels, then it is considered to be noise-dominated and hence unusable.
| Quadrant | # 1 sec bins | Bins with >0 counts | Bins with >2000 counts | High rate bins dominated by noise | Noise dominated (total time) | Noise dominated (detector-on time) | Marked lightcurve |
|---|---|---|---|---|---|---|---|
| A | 173074 | 120209 | 24 | 24 | 0.01% | 0.02% | 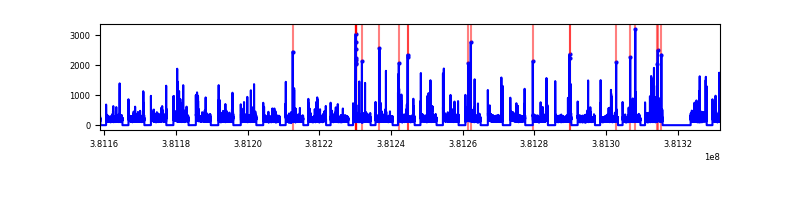 |
| B | 173074 | 120194 | 462 | 462 | 0.27% | 0.38% | 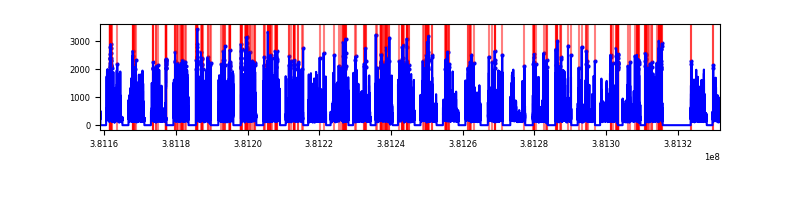 |
| C | 173074 | 120186 | 257 | 257 | 0.15% | 0.21% | 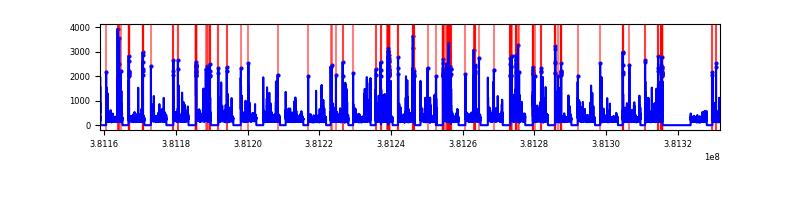 |
| D | 173074 | 120190 | 3700 | 3700 | 2.14% | 3.08% | 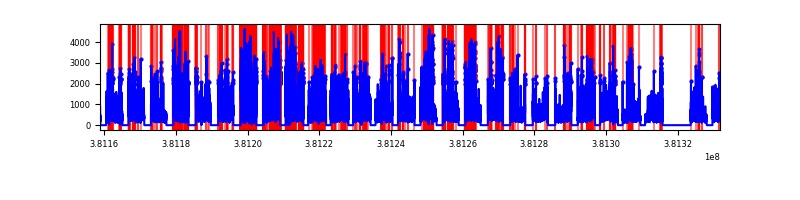 |
Top three noisy pixels from each quadrant. If the there are fewer than three noisy pixels in the level2.evt file, extra rows are filled as -1
| Pixel properties | Quadrant properties | ||||||
|---|---|---|---|---|---|---|---|
| Quadrant | DetID | PixID | Counts | Sigma | Mean | Median | Sigma |
| A | 9 | 143 | 545999 | 396.46 | 6234 | 6140 | 1361.7 |
| A | 10 | 83 | 379543 | 274.22 | 6234 | 6140 | 1361.7 |
| A | 13 | 6 | 229419 | 163.97 | 6234 | 6140 | 1361.7 |
| B | 5 | 172 | 11492035 | 9483.4 | 6233 | 6100 | 1211.2 |
| B | 4 | 251 | 2659141 | 2190.49 | 6233 | 6100 | 1211.2 |
| B | 0 | 229 | 1106022 | 908.15 | 6233 | 6100 | 1211.2 |
| C | 15 | 214 | 4893929 | 3390.8 | 6281 | 6253 | 1441.5 |
| C | 14 | 254 | 2776225 | 1921.65 | 6281 | 6253 | 1441.5 |
| C | 0 | 10 | 980719 | 676.03 | 6281 | 6253 | 1441.5 |
| D | 8 | 195 | 19863447 | 12631.99 | 6053 | 5934 | 1572.0 |
| D | 7 | 223 | 12936582 | 8225.59 | 6053 | 5934 | 1572.0 |
| D | 12 | 235 | 9178289 | 5834.82 | 6053 | 5934 | 1572.0 |
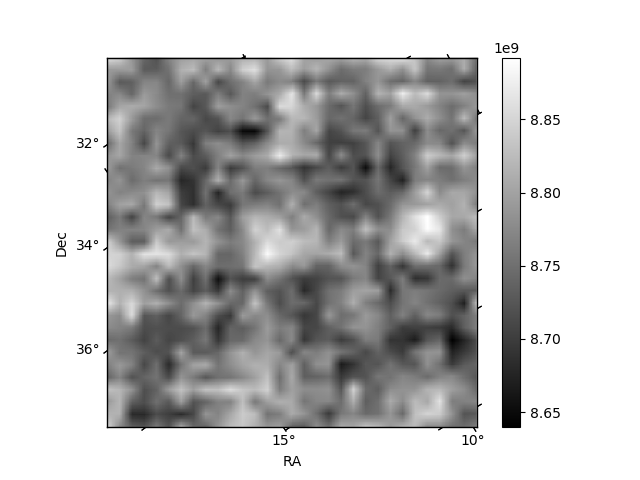
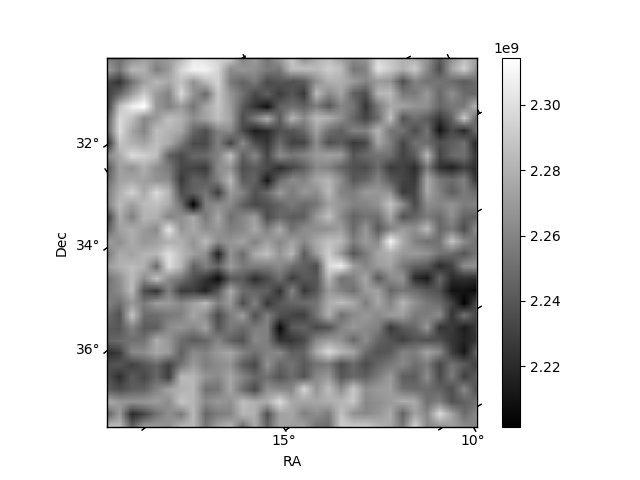
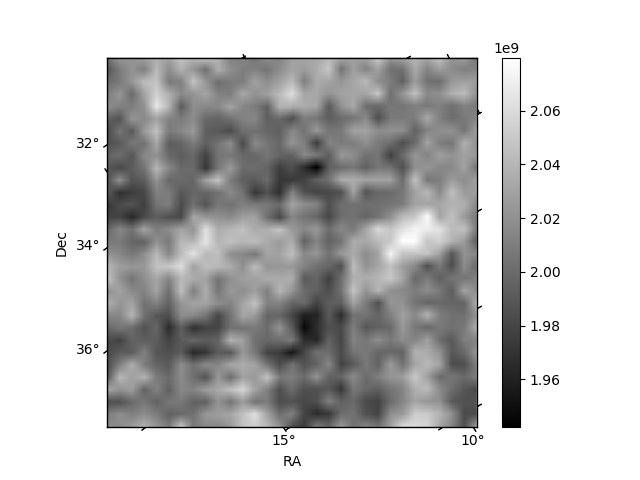
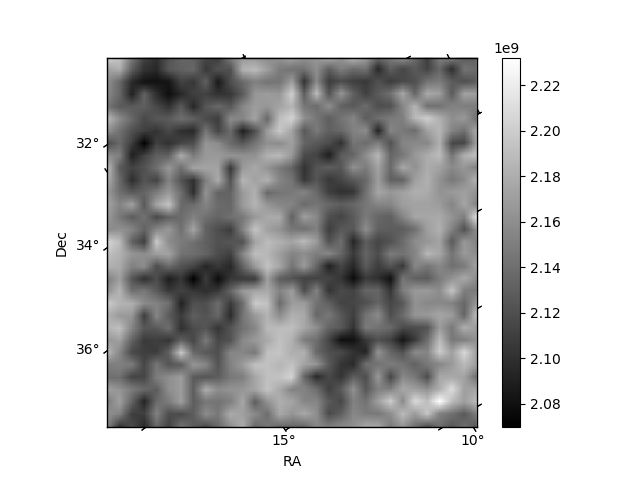
Histogram calculated using DETX and DETY for each event in the final _common_clean file
| Quadrant A | 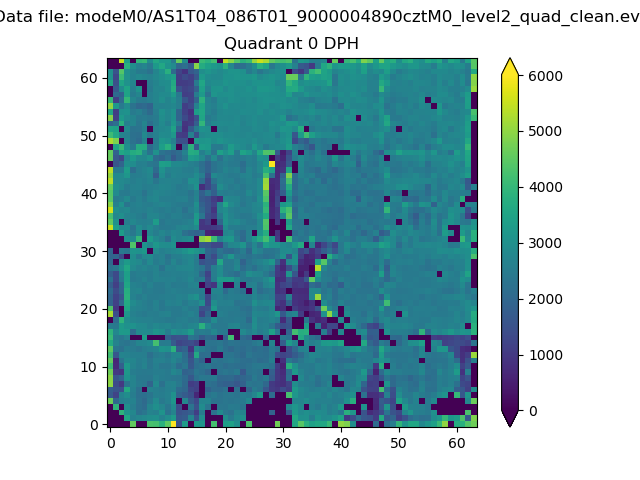 |
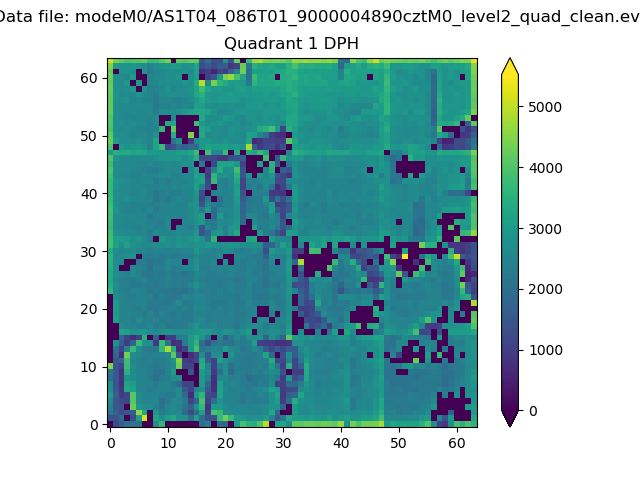 |
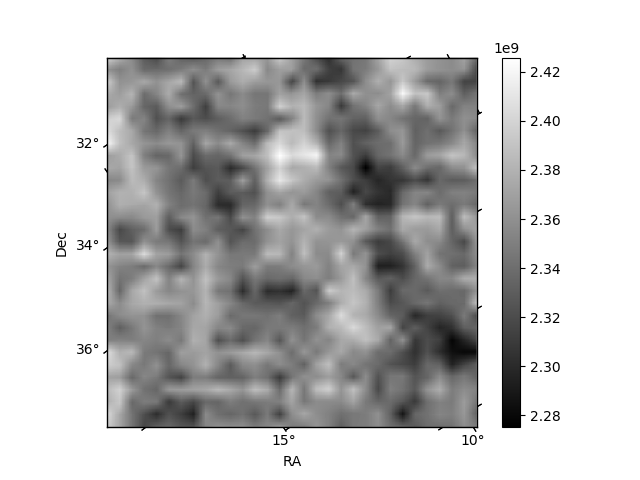
Quadrant B |
|---|---|---|---|
| Quadrant D | 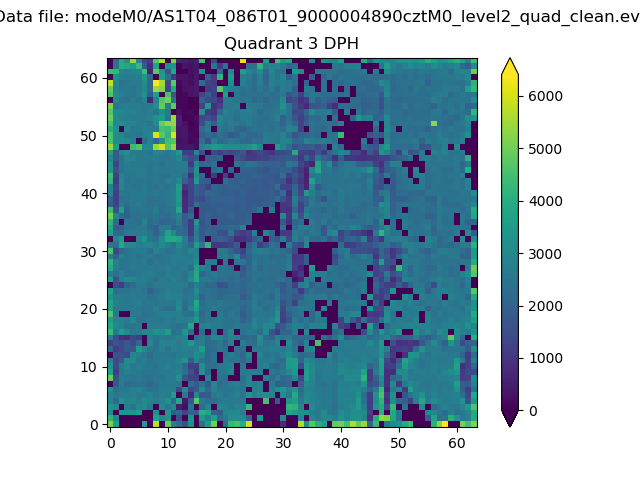 |
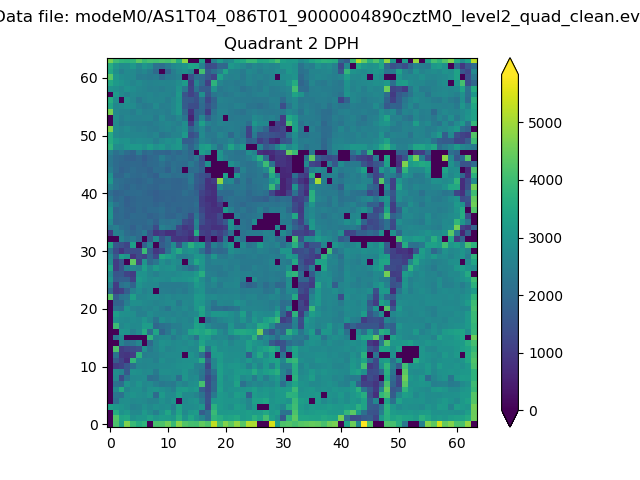 |
Quadrant C |
| Plot type | Count rate plots | Images |
|---|---|---|
| Comparison with Poisson distribution Blue bars denote a histogram of data divided into 1 sec bins. Red curve is a Poisson curve with rate = median count rate of data. |
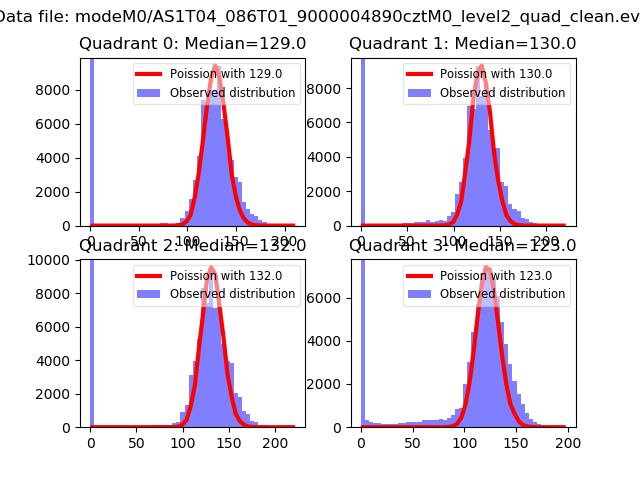 |
 |
| Quadrant-wise count rates Data is divided into 100 sec bins |
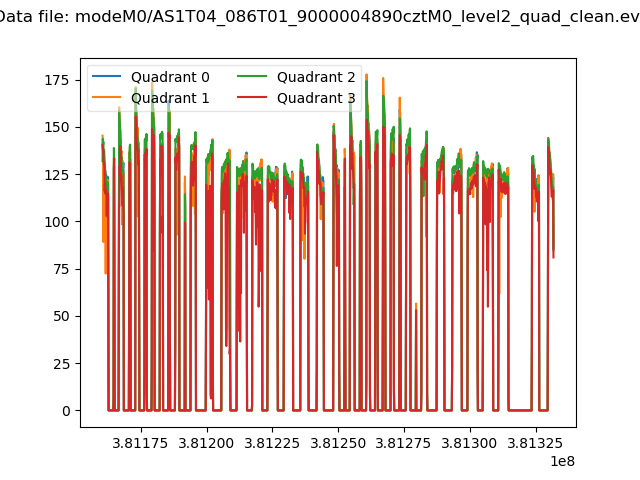 |
|
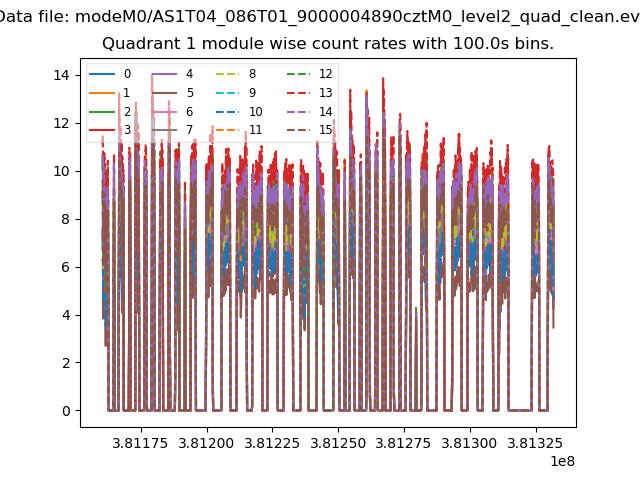
| Module-wise count rates for Quadrant A Data is divided into 100 sec bins |
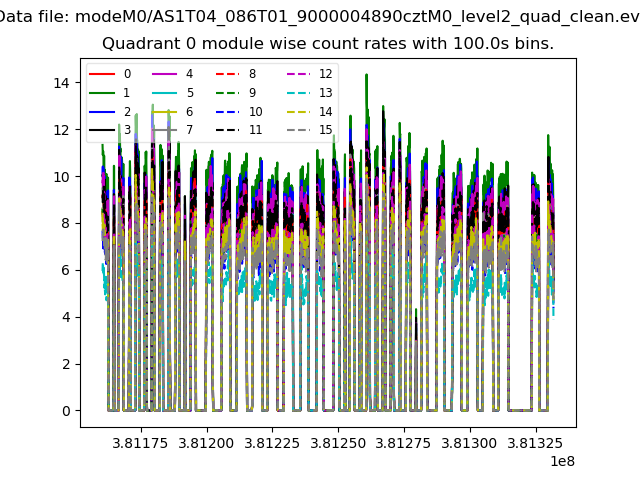 |
 |
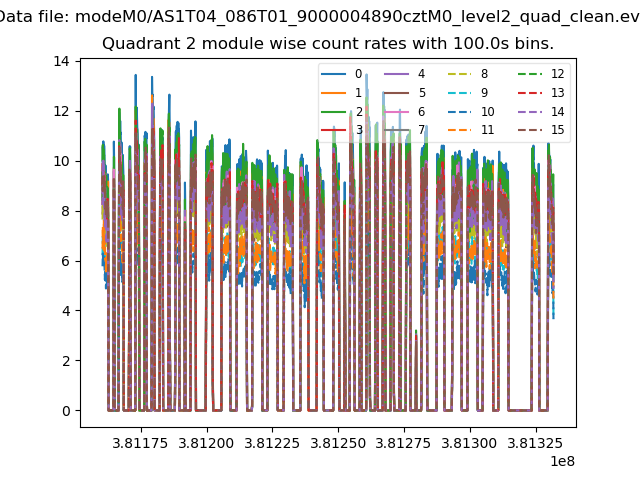
| Module-wise count rates for Quadrant B Data is divided into 100 sec bins |
 |
 |
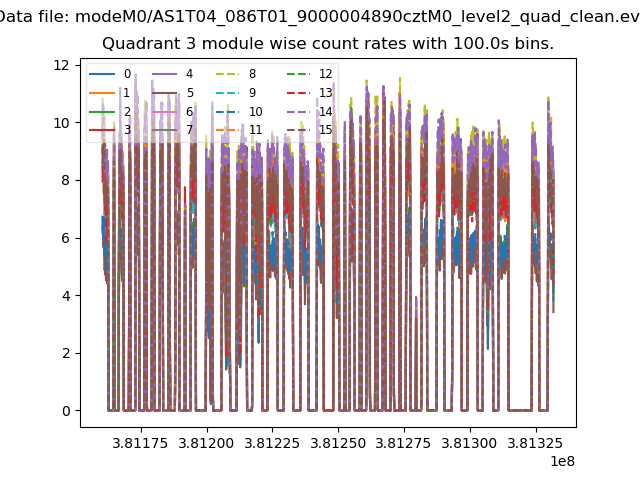
| Module-wise count rates for Quadrant C Data is divided into 100 sec bins |
 |
 |
| Module-wise count rates for Quadrant D Data is divided into 100 sec bins |
 |
 |
| Parameter | Plot |
|---|---|
| CZT HV Monitor | 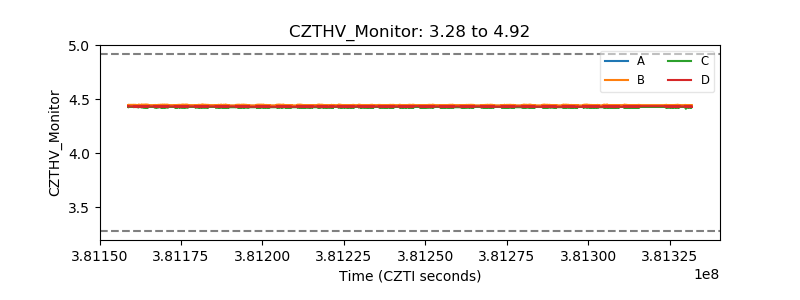 |
| D_VDD | 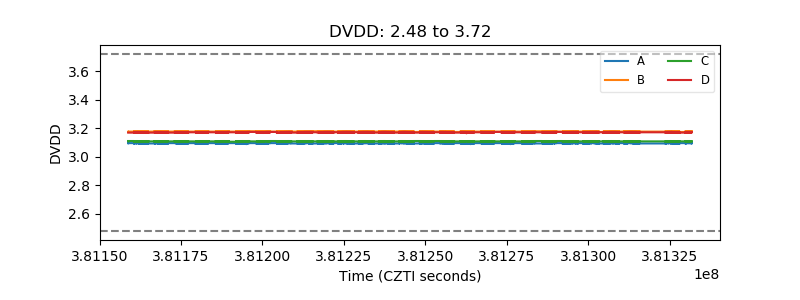 |
| Temperature 1 | 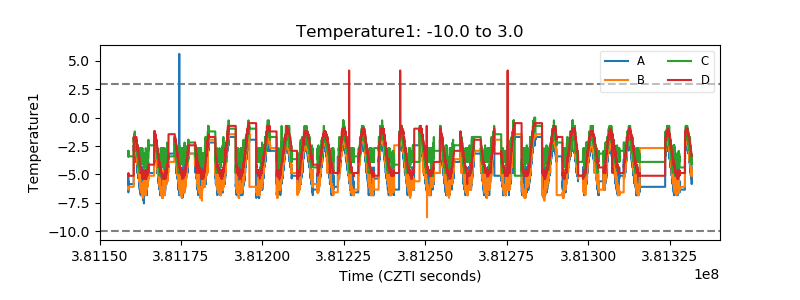 |
| Veto HV Monitor | 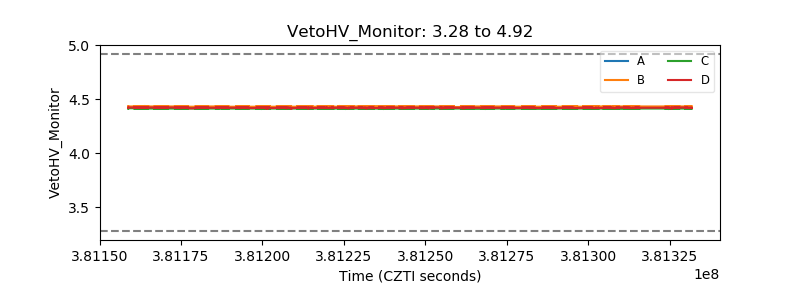 |
| Veto LLD | 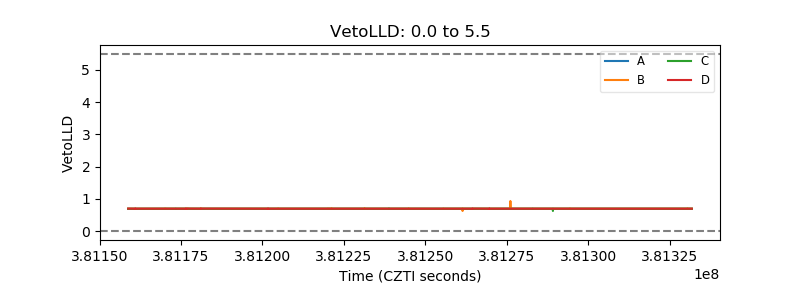 |
| Alpha Counter | 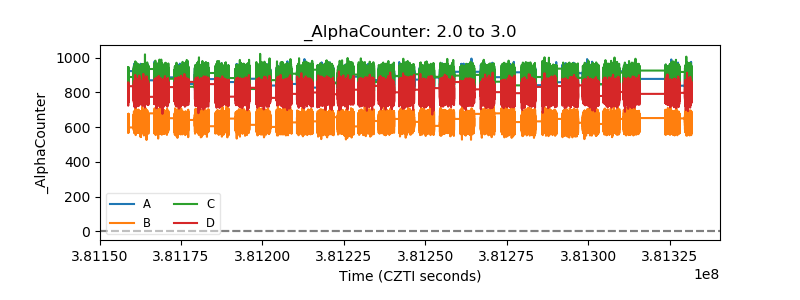 |
| _CPM_Rate | 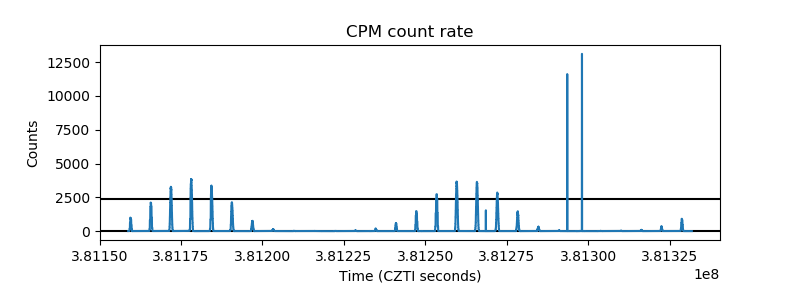 |
| CZT Counter | 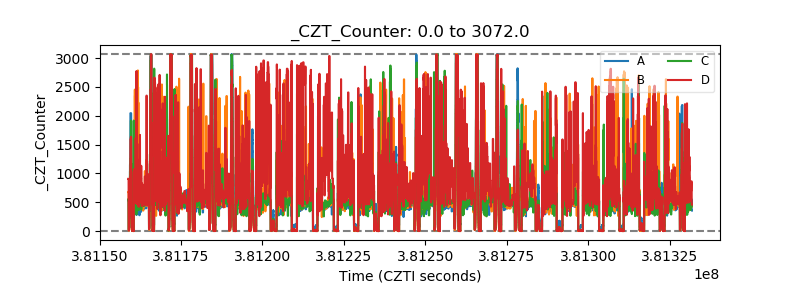 |
| +2.5 Volts monitor | 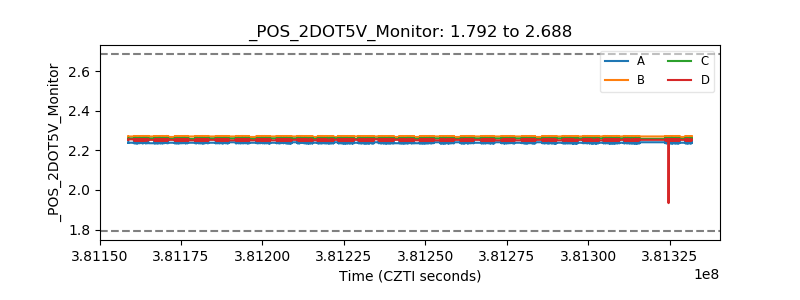 |
| +5 Volts monitor | 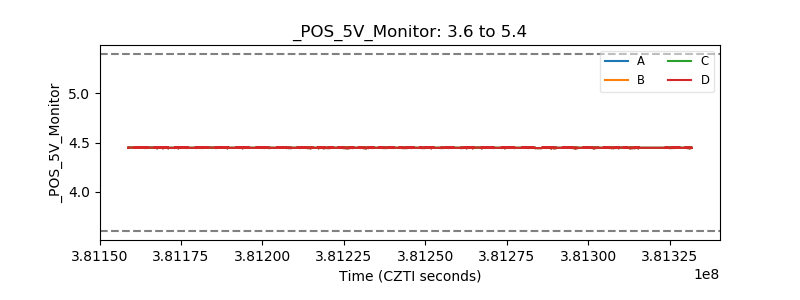 |
| _ROLL_ROT | 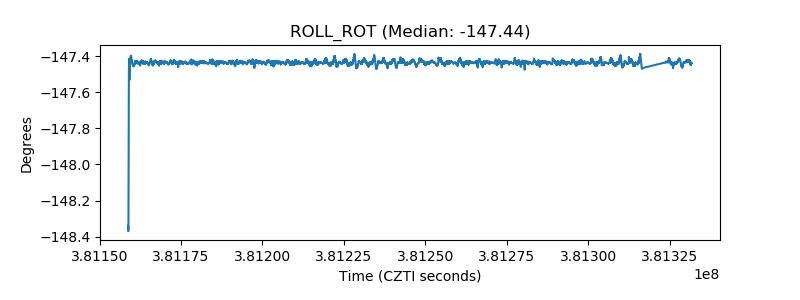 |
| _Roll_DEC | 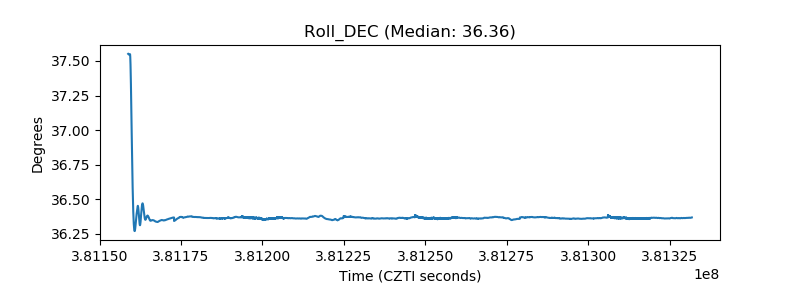 |
| _Roll_RA | 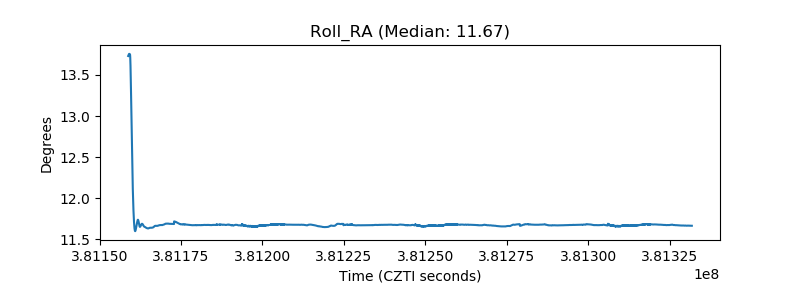 |
| Veto Counter | 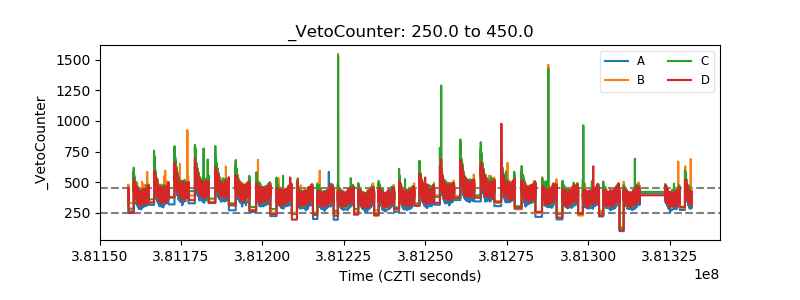 |