| Param | Original file | Final file |
|---|---|---|
| Filename | modeM0/AS1T05_003T01_9000004886_34234cztM0_level2.evt | modeM0/AS1T05_003T01_9000004886_34234cztM0_level2_quad_clean.evt |
| Size (bytes) | 347,621,760 | 47,816,640 |
| Size | 331.5 MB | 45.6 MB |
| Events in quadrant A | 2,166,386 | 283,239 |
| Events in quadrant B | 2,290,303 | 296,765 |
| Events in quadrant C | 2,636,204 | 294,266 |
| Events in quadrant D | 3,150,435 | 278,800 |
| Mode M9 | |||
|---|---|---|---|
| Quadrant | BADHDUFLAG | Total packets | Discarded packets |
| A | 0 | 14 | 0 |
| B | 0 | 14 | 0 |
| C | 0 | 14 | 0 |
| D | 0 | 15 | 0 |
| Mode SS | |||
|---|---|---|---|
| Quadrant | BADHDUFLAG | Total packets | Discarded packets |
| A | 0 | 86 | 0 |
| B | 0 | 86 | 0 |
| C | 0 | 86 | 0 |
| D | 0 | 86 | 0 |
| Mode M0 | |||
|---|---|---|---|
| Quadrant | BADHDUFLAG | Total packets | Discarded packets |
| A | 0 | 8847 | 1 |
| B | 0 | 9147 | 1 |
| C | 0 | 10234 | 1 |
| D | 0 | 12081 | 1 |
| Quadrant | Total seconds | Saturated seconds | Saturation percentage |
|---|---|---|---|
| A | 4178 | 15 | 0.359023% |
| B | 4178 | 25 | 0.598372% |
| C | 4178 | 89 | 2.130206% |
| D | 4178 | 58 | 1.388224% |
Noise dominated data is calculated using 1-second bins in cleaned event files. If a bin has >2000 counts, and if more than 50% of those come from <1% of pixels, then it is considered to be noise-dominated and hence unusable.
| Quadrant | # 1 sec bins | Bins with >0 counts | Bins with >2000 counts | High rate bins dominated by noise | Noise dominated (total time) | Noise dominated (detector-on time) | Marked lightcurve |
|---|---|---|---|---|---|---|---|
| A | 4178 | 4178 | 10 | 10 | 0.24% | 0.24% | 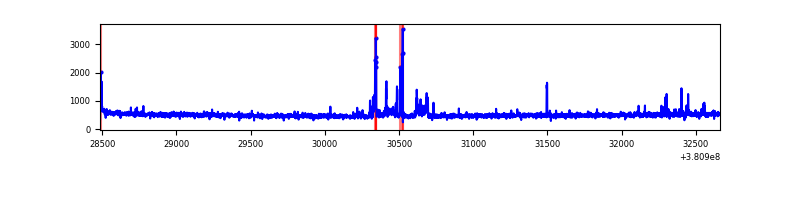 |
| B | 4178 | 4178 | 10 | 10 | 0.24% | 0.24% | 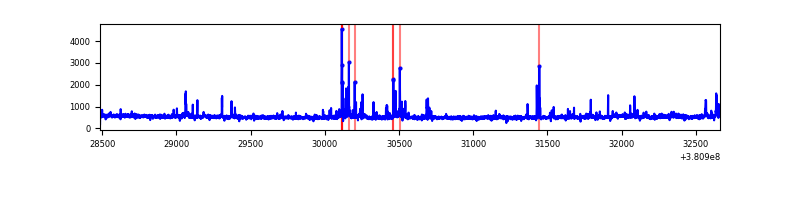 |
| C | 4178 | 4178 | 61 | 61 | 1.46% | 1.46% | 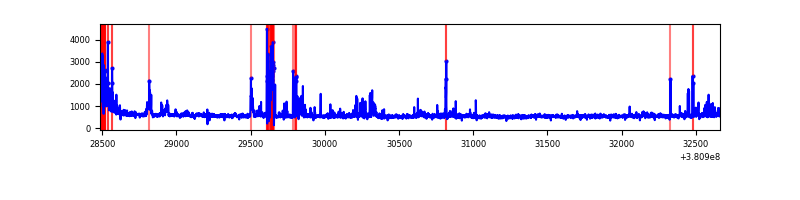 |
| D | 4178 | 4178 | 42 | 42 | 1.01% | 1.01% | 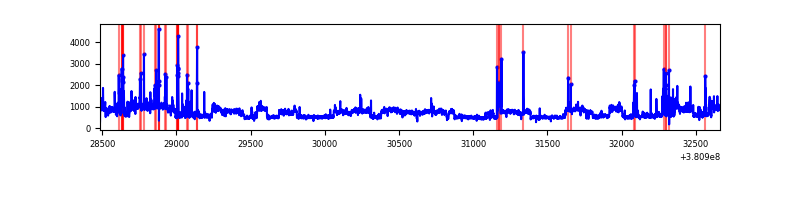 |
Top three noisy pixels from each quadrant. If the there are fewer than three noisy pixels in the level2.evt file, extra rows are filled as -1
| Pixel properties | Quadrant properties | ||||||
|---|---|---|---|---|---|---|---|
| Quadrant | DetID | PixID | Counts | Sigma | Mean | Median | Sigma |
| A | 9 | 143 | 62274 | 585.13 | 524 | 514 | 105.5 |
| A | 15 | 169 | 55261 | 518.68 | 524 | 514 | 105.5 |
| A | 10 | 83 | 12397 | 112.58 | 524 | 514 | 105.5 |
| B | 5 | 172 | 90504 | 901.24 | 529 | 517 | 99.8 |
| B | 5 | 255 | 63681 | 632.6 | 529 | 517 | 99.8 |
| B | 0 | 189 | 31661 | 311.91 | 529 | 517 | 99.8 |
| C | 14 | 254 | 208606 | 1755.4 | 515 | 520 | 118.5 |
| C | 15 | 214 | 180444 | 1517.83 | 515 | 520 | 118.5 |
| C | 0 | 10 | 131039 | 1101.05 | 515 | 520 | 118.5 |
| D | 8 | 195 | 856205 | 6853.11 | 515 | 502 | 124.9 |
| D | 12 | 6 | 115966 | 924.72 | 515 | 502 | 124.9 |
| D | 2 | 249 | 93617 | 745.73 | 515 | 502 | 124.9 |
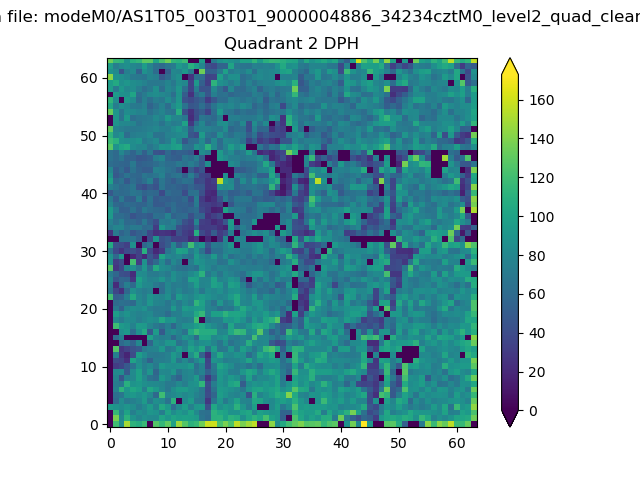
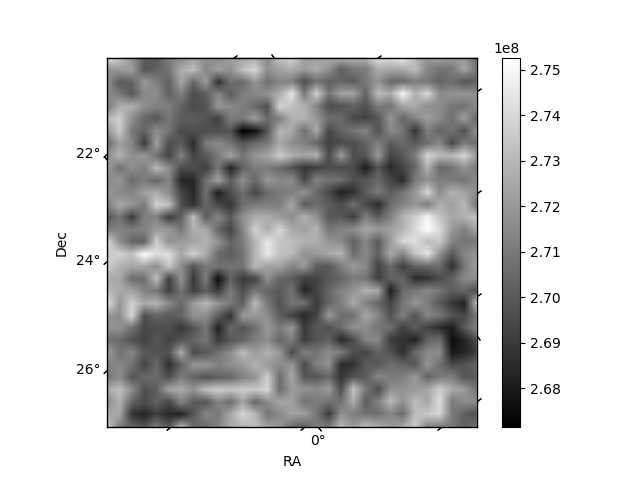
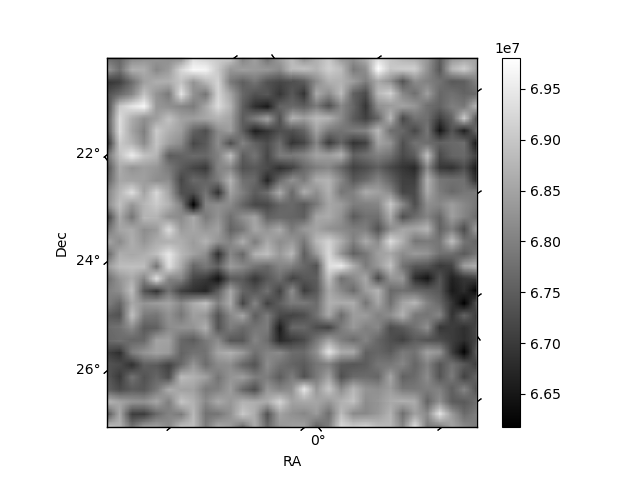
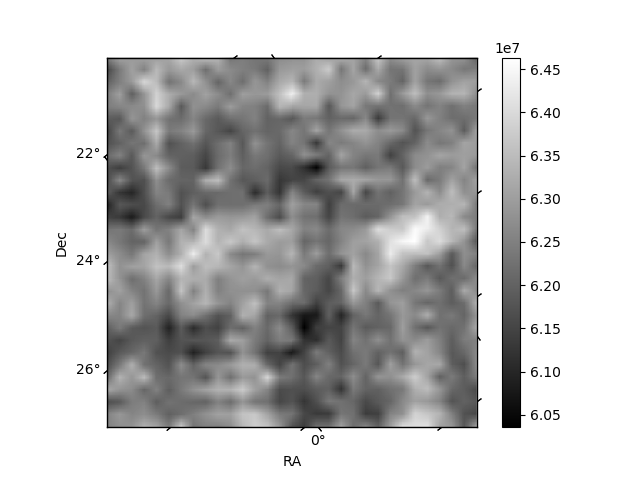
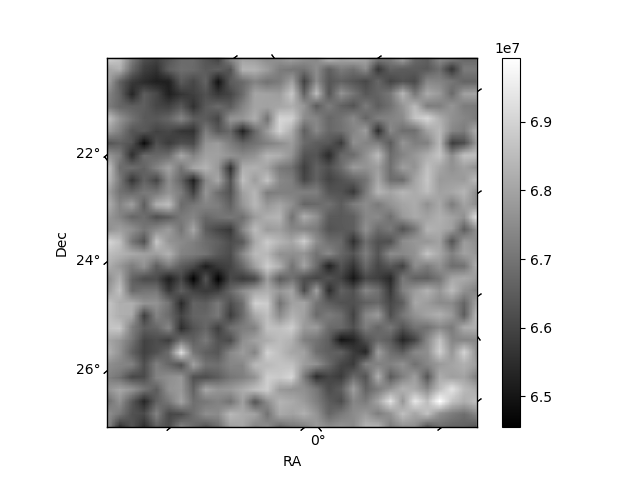
Histogram calculated using DETX and DETY for each event in the final _common_clean file
| Quadrant A | 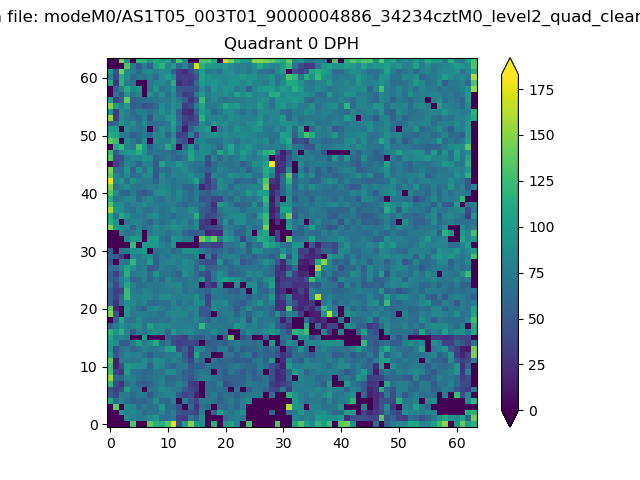 |
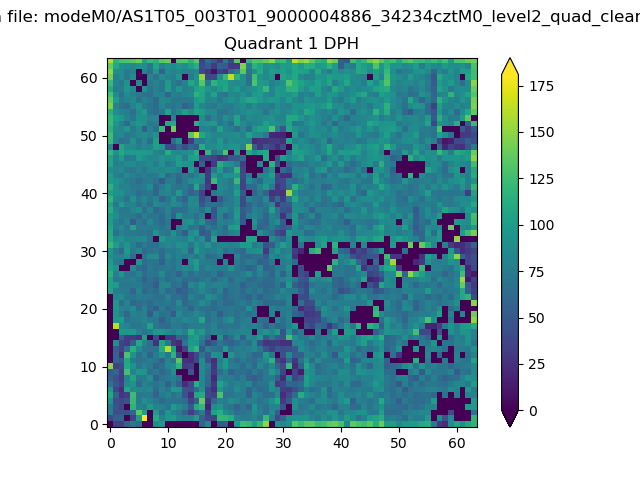 |
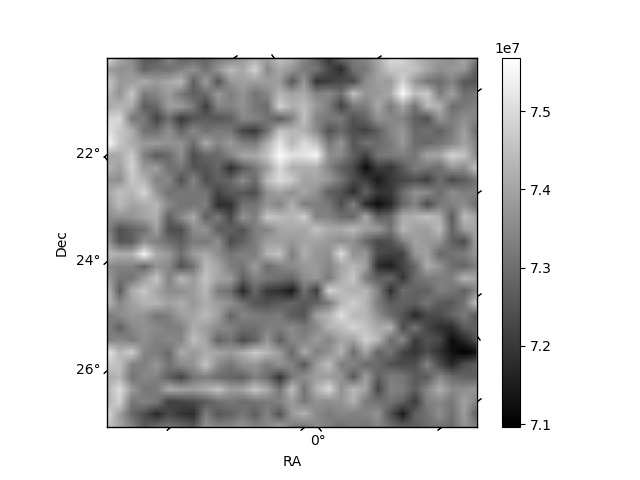
Quadrant B |
|---|---|---|---|
| Quadrant D | 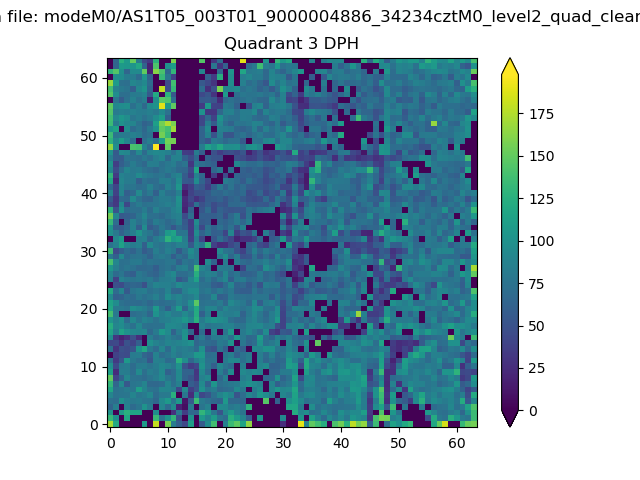 |
 |
Quadrant C |
| Plot type | Count rate plots | Images |
|---|---|---|
| Comparison with Poisson distribution Blue bars denote a histogram of data divided into 1 sec bins. Red curve is a Poisson curve with rate = median count rate of data. |
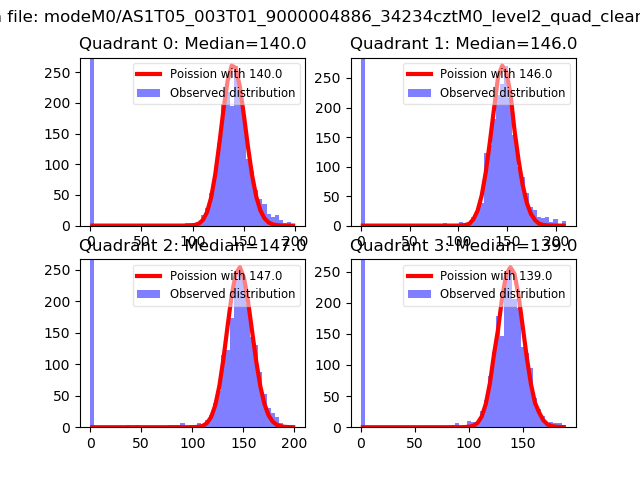 |
 |
| Quadrant-wise count rates Data is divided into 100 sec bins |
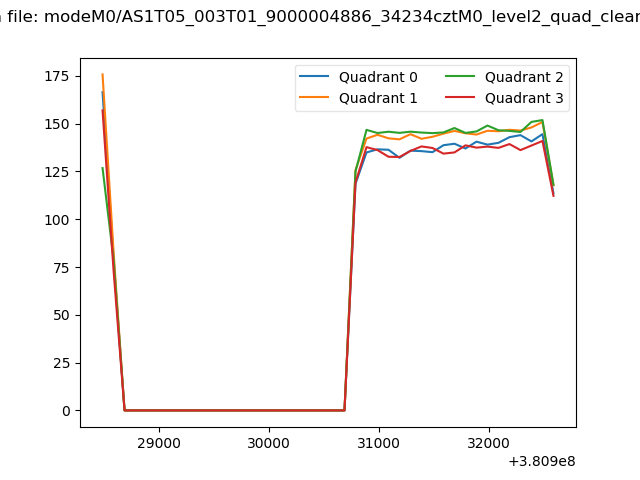 |
|
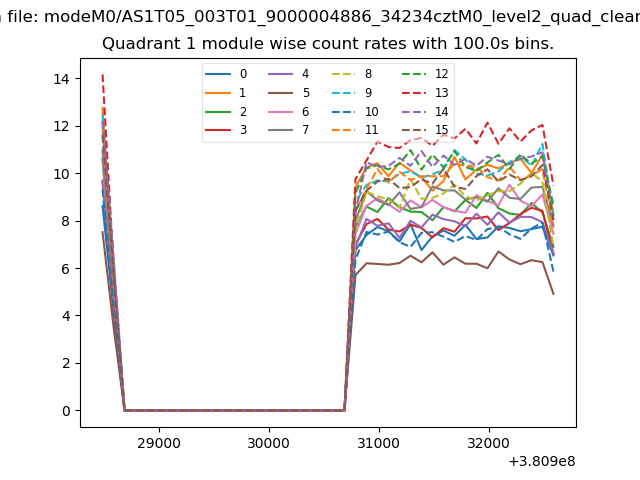
| Module-wise count rates for Quadrant A Data is divided into 100 sec bins |
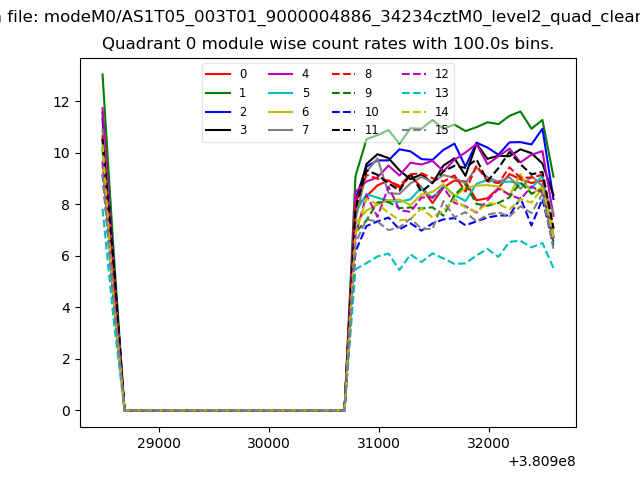 |
 |
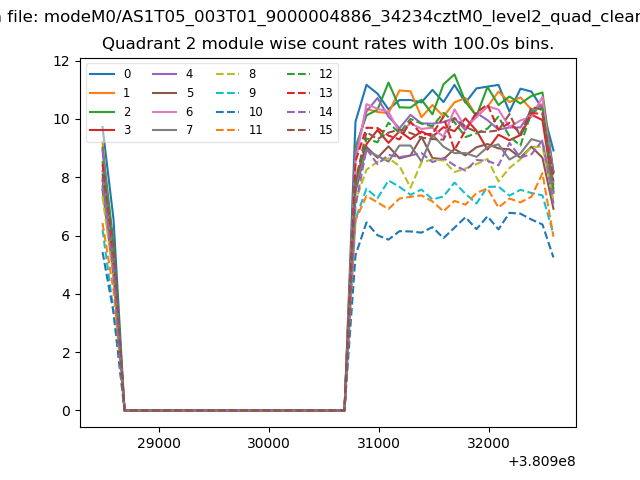
| Module-wise count rates for Quadrant B Data is divided into 100 sec bins |
 |
 |
| Module-wise count rates for Quadrant C Data is divided into 100 sec bins |
 |
 |
| Module-wise count rates for Quadrant D Data is divided into 100 sec bins |
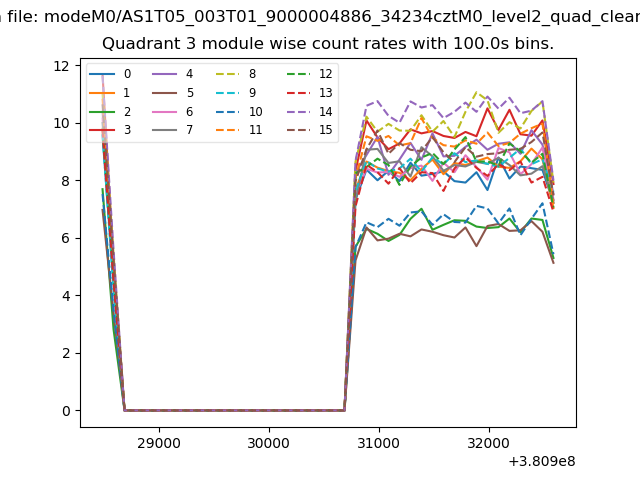 |
 |
| Parameter | Plot |
|---|---|
| CZT HV Monitor | 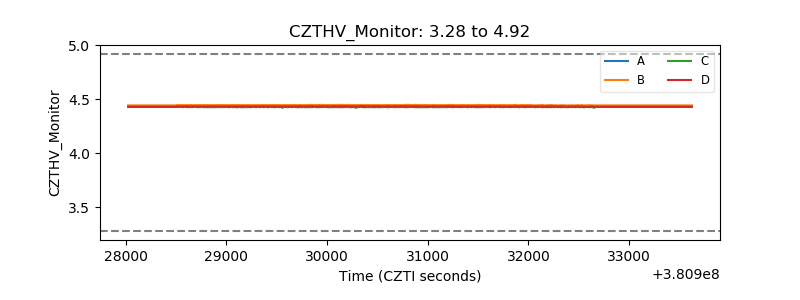 |
| D_VDD | 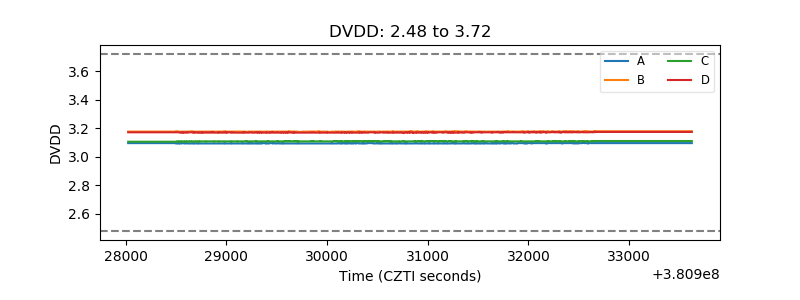 |
| Temperature 1 | 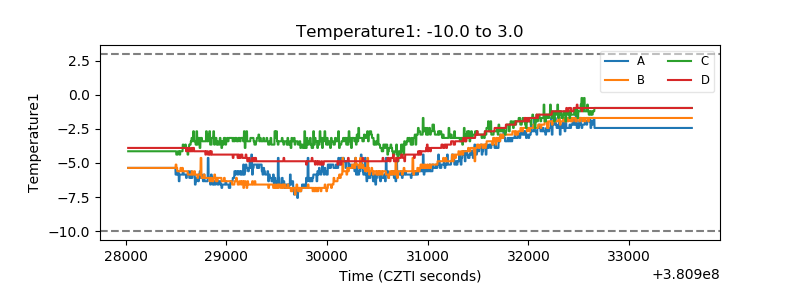 |
| Veto HV Monitor | 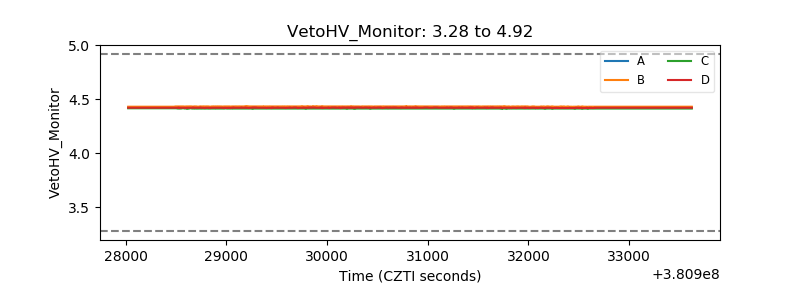 |
| Veto LLD | 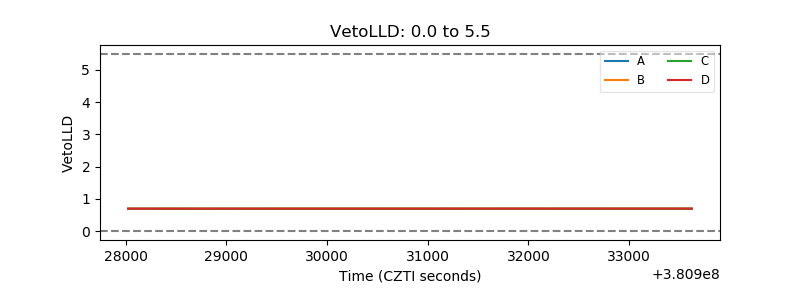 |
| Alpha Counter | 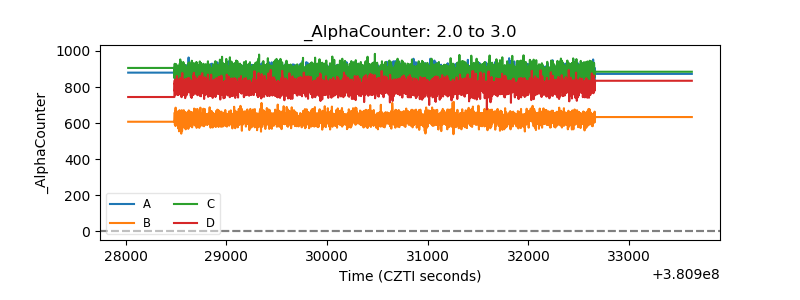 |
| _CPM_Rate | 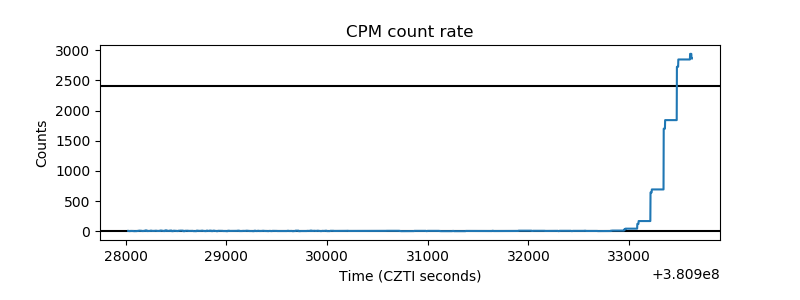 |
| CZT Counter | 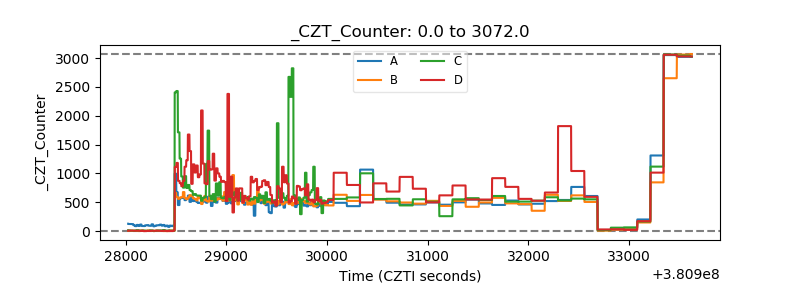 |
| +2.5 Volts monitor | 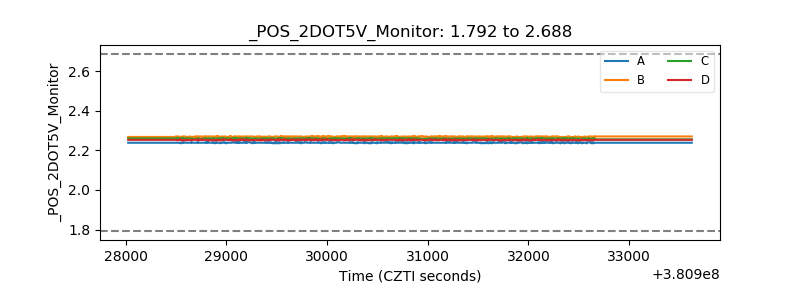 |
| +5 Volts monitor | 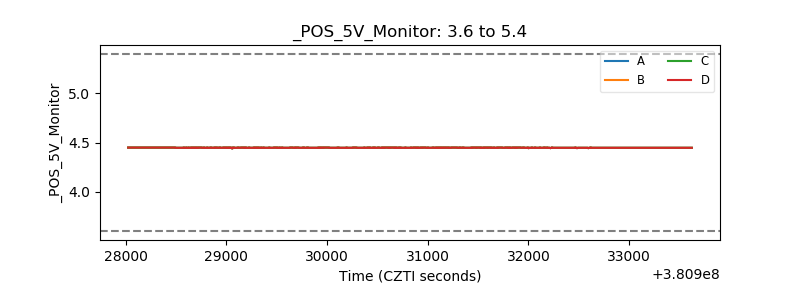 |
| _ROLL_ROT | 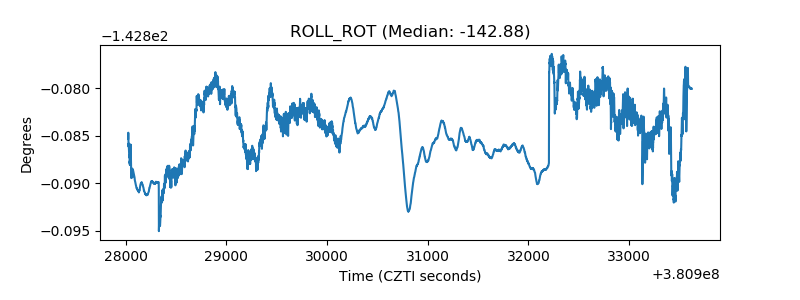 |
| _Roll_DEC | 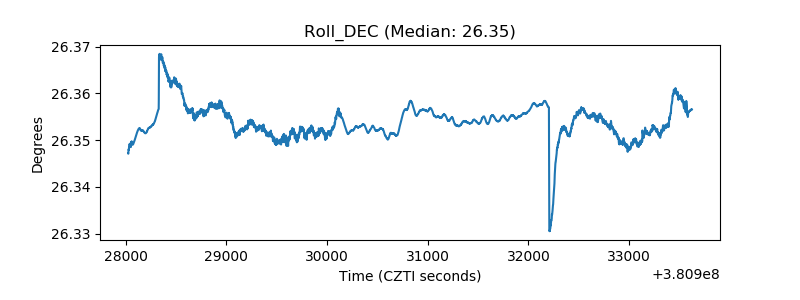 |
| _Roll_RA | 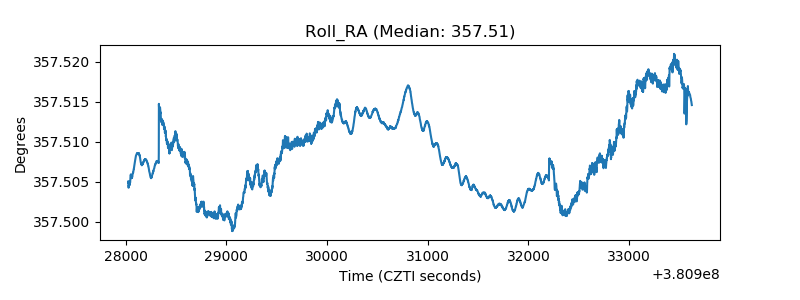 |
| Veto Counter | 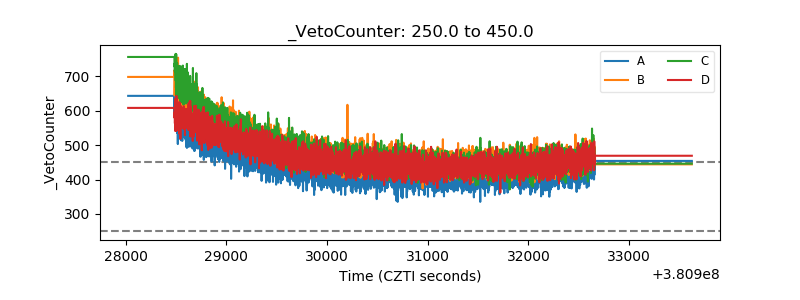 |