| Param | Original file | Final file |
|---|---|---|
| Filename | modeM0/AS1A11_059T09_9000004888_34257cztM0_level2.evt | modeM0/AS1A11_059T09_9000004888_34257cztM0_level2_quad_clean.evt |
| Size (bytes) | 1,327,003,200 | 178,790,400 |
| Size | 1.2 GB | 170.5 MB |
| Events in quadrant A | 7,170,503 | 1,112,683 |
| Events in quadrant B | 9,075,104 | 1,117,037 |
| Events in quadrant C | 9,272,378 | 1,091,284 |
| Events in quadrant D | 13,627,997 | 1,026,412 |
| Mode M0 | |||
|---|---|---|---|
| Quadrant | BADHDUFLAG | Total packets | Discarded packets |
| A | 0 | 31486 | 0 |
| B | 0 | 36671 | 0 |
| C | 0 | 36698 | 0 |
| D | 0 | 50879 | 0 |
| Mode SS | |||
|---|---|---|---|
| Quadrant | BADHDUFLAG | Total packets | Discarded packets |
| A | 0 | 314 | 0 |
| B | 0 | 314 | 0 |
| C | 0 | 314 | 0 |
| D | 0 | 314 | 0 |
| Mode M9 | |||
|---|---|---|---|
| Quadrant | BADHDUFLAG | Total packets | Discarded packets |
| A | 0 | 48 | 0 |
| B | 0 | 48 | 0 |
| C | 0 | 48 | 0 |
| D | 0 | 49 | 0 |
| Quadrant | Total seconds | Saturated seconds | Saturation percentage |
|---|---|---|---|
| A | 15469 | 21 | 0.135755% |
| B | 15469 | 464 | 2.999547% |
| C | 15469 | 317 | 2.049260% |
| D | 15469 | 902 | 5.831017% |
Noise dominated data is calculated using 1-second bins in cleaned event files. If a bin has >2000 counts, and if more than 50% of those come from <1% of pixels, then it is considered to be noise-dominated and hence unusable.
| Quadrant | # 1 sec bins | Bins with >0 counts | Bins with >2000 counts | High rate bins dominated by noise | Noise dominated (total time) | Noise dominated (detector-on time) | Marked lightcurve |
|---|---|---|---|---|---|---|---|
| A | 19768 | 15472 | 2 | 2 | 0.01% | 0.01% | 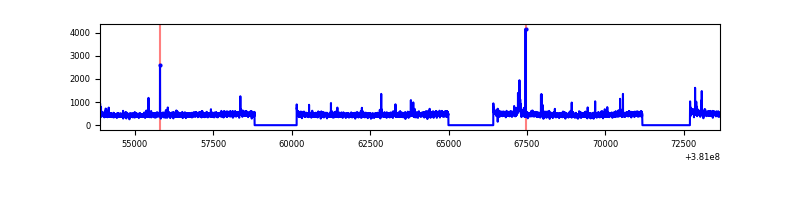 |
| B | 19768 | 15472 | 274 | 274 | 1.39% | 1.77% | 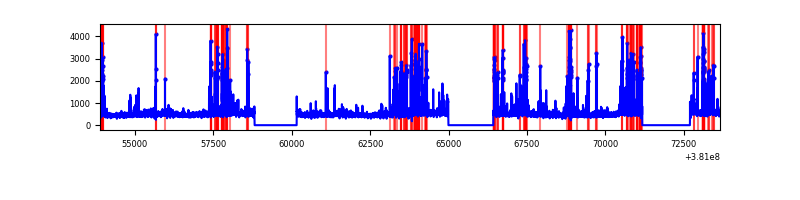 |
| C | 19768 | 15472 | 271 | 271 | 1.37% | 1.75% | 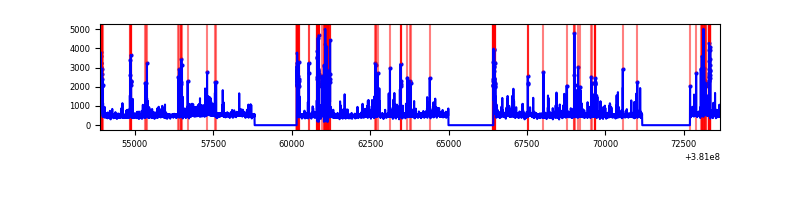 |
| D | 19768 | 15472 | 984 | 984 | 4.98% | 6.36% | 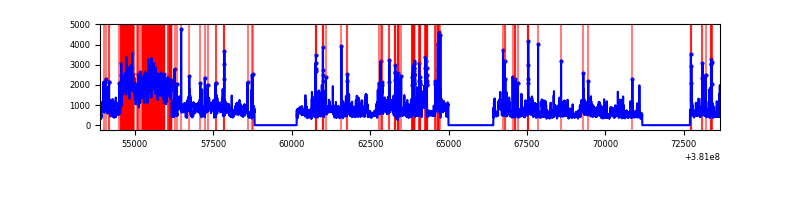 |
Top three noisy pixels from each quadrant. If the there are fewer than three noisy pixels in the level2.evt file, extra rows are filled as -1
| Pixel properties | Quadrant properties | ||||||
|---|---|---|---|---|---|---|---|
| Quadrant | DetID | PixID | Counts | Sigma | Mean | Median | Sigma |
| A | 15 | 169 | 69926 | 190.69 | 1798 | 1762 | 357.5 |
| A | 10 | 83 | 52829 | 142.86 | 1798 | 1762 | 357.5 |
| A | 9 | 143 | 39165 | 104.63 | 1798 | 1762 | 357.5 |
| B | 5 | 172 | 1501189 | 4446.18 | 1774 | 1730 | 337.2 |
| B | 0 | 189 | 236706 | 696.75 | 1774 | 1730 | 337.2 |
| B | 0 | 229 | 77164 | 223.68 | 1774 | 1730 | 337.2 |
| C | 0 | 207 | 716809 | 1787.13 | 1732 | 1742 | 400.1 |
| C | 15 | 214 | 664821 | 1657.2 | 1732 | 1742 | 400.1 |
| C | 0 | 10 | 535546 | 1334.11 | 1732 | 1742 | 400.1 |
| D | 8 | 195 | 3604405 | 8396.94 | 1728 | 1678 | 429.1 |
| D | 7 | 223 | 2179175 | 5075.13 | 1728 | 1678 | 429.1 |
| D | 2 | 249 | 358493 | 831.63 | 1728 | 1678 | 429.1 |
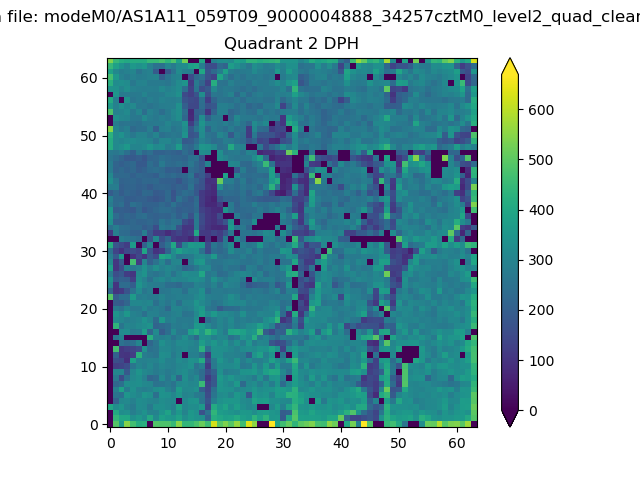
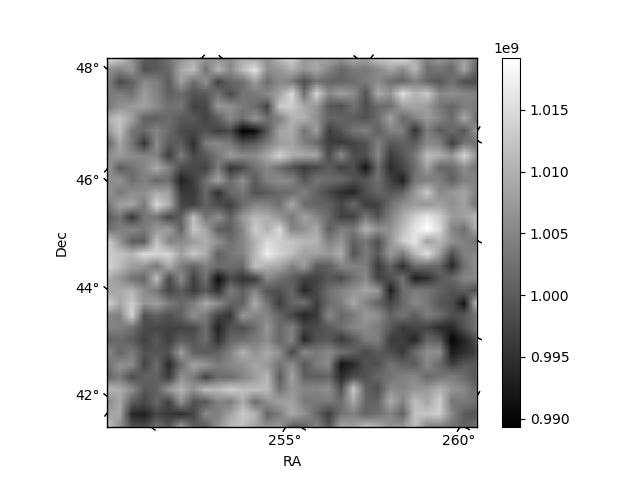
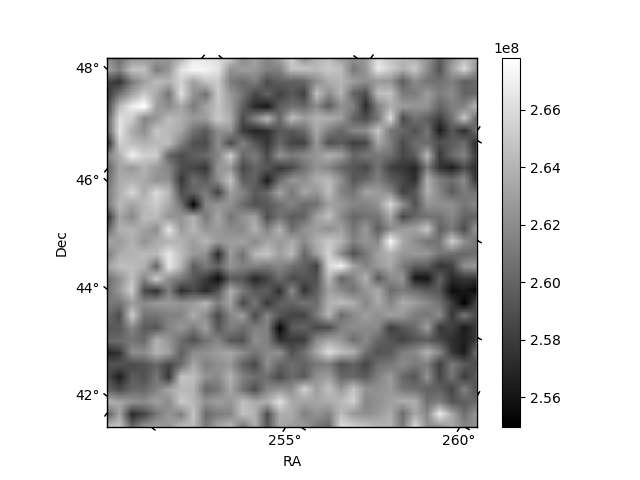
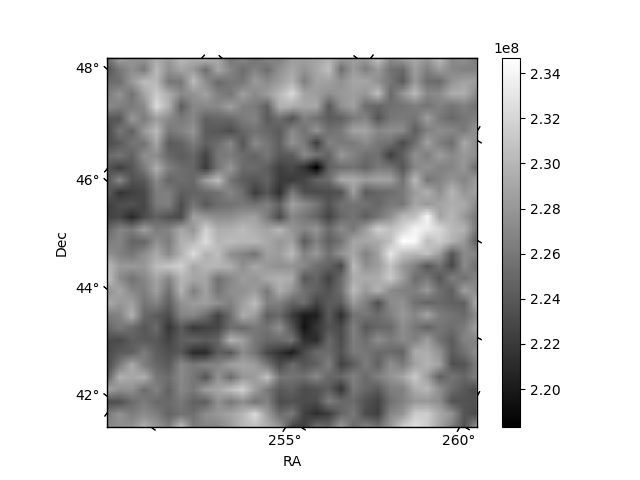
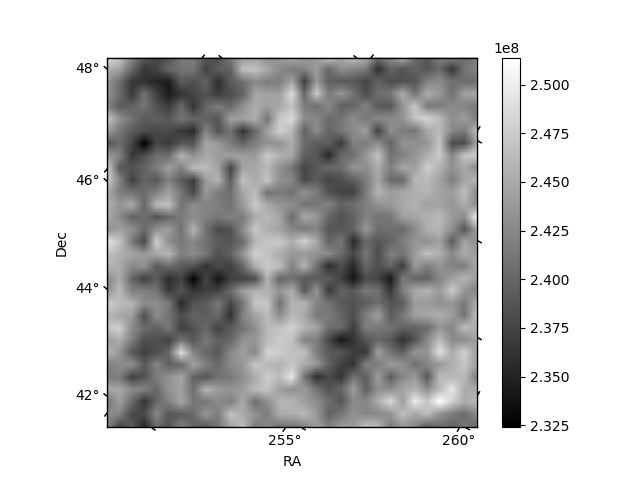
Histogram calculated using DETX and DETY for each event in the final _common_clean file
| Quadrant A | 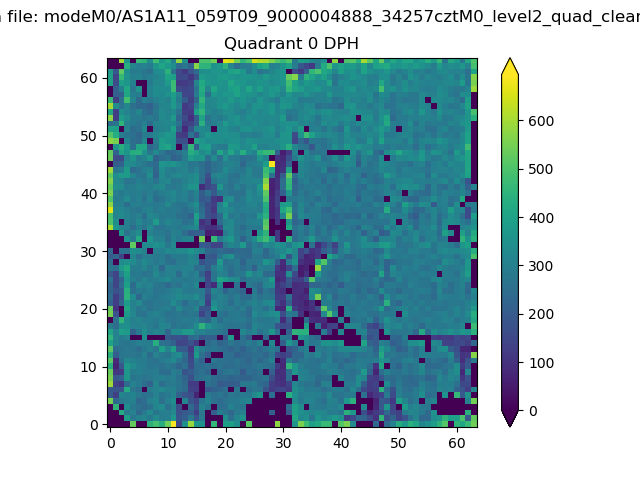 |
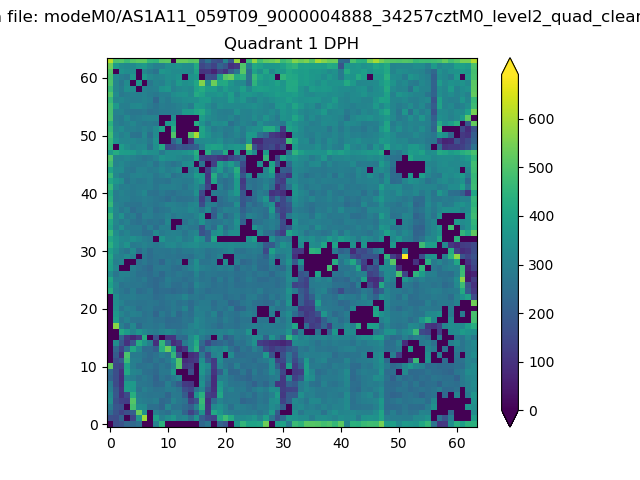 |
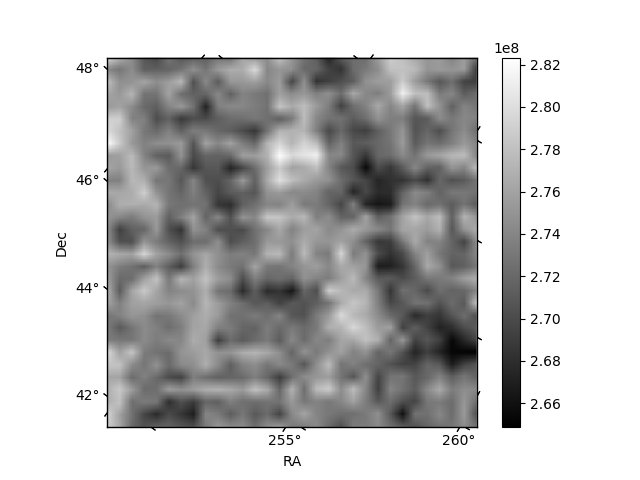
Quadrant B |
|---|---|---|---|
| Quadrant D | 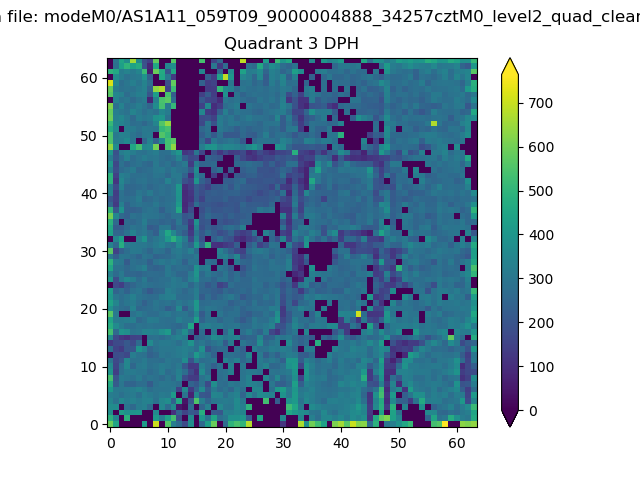 |
 |
Quadrant C |
| Plot type | Count rate plots | Images |
|---|---|---|
| Comparison with Poisson distribution Blue bars denote a histogram of data divided into 1 sec bins. Red curve is a Poisson curve with rate = median count rate of data. |
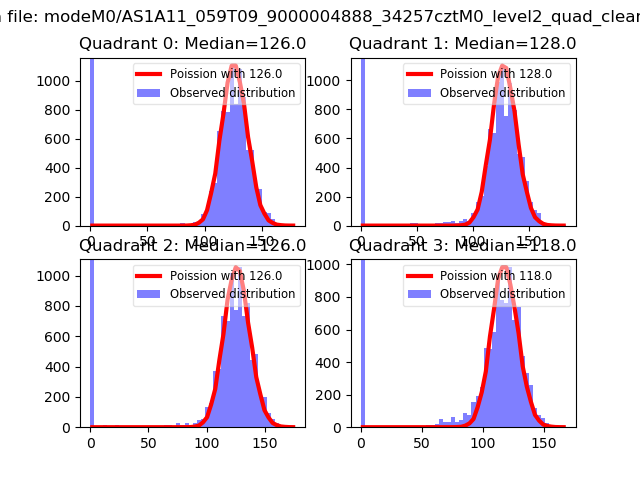 |
 |
| Quadrant-wise count rates Data is divided into 100 sec bins |
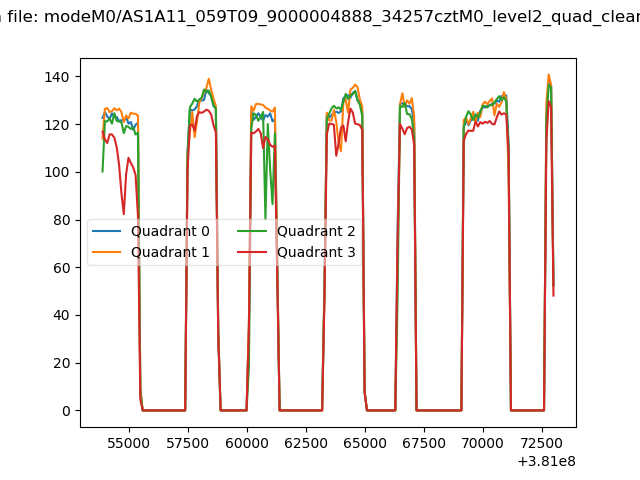 |
|
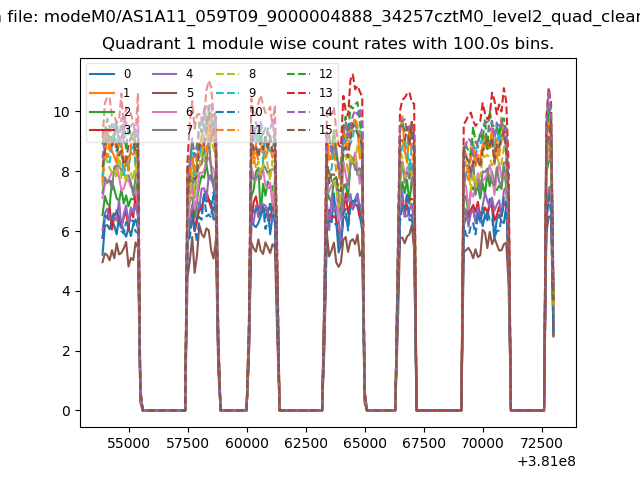
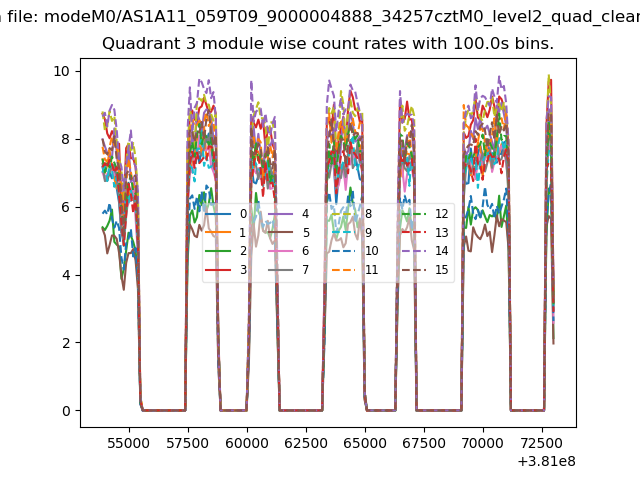
| Module-wise count rates for Quadrant A Data is divided into 100 sec bins |
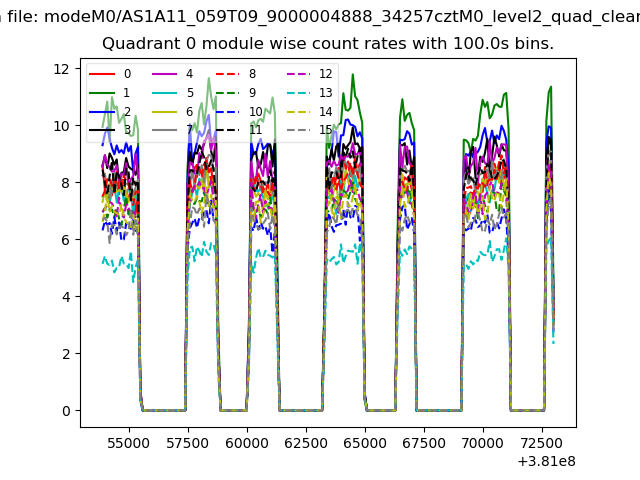 |
 |
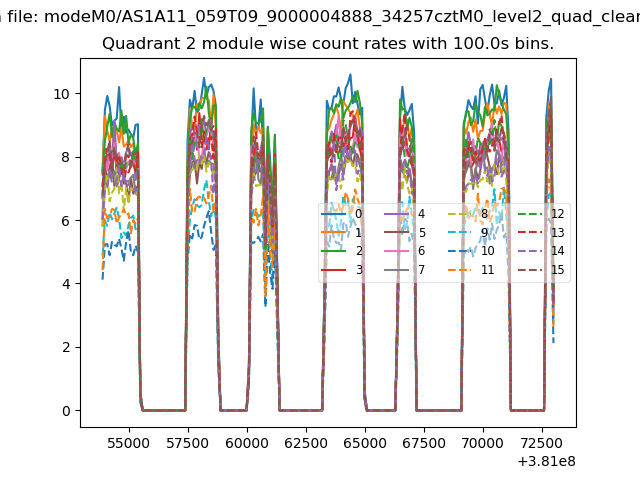
| Module-wise count rates for Quadrant B Data is divided into 100 sec bins |
 |
 |
| Module-wise count rates for Quadrant C Data is divided into 100 sec bins |
 |
 |
| Module-wise count rates for Quadrant D Data is divided into 100 sec bins |
 |
 |
| Parameter | Plot |
|---|---|
| CZT HV Monitor |  |
| D_VDD | 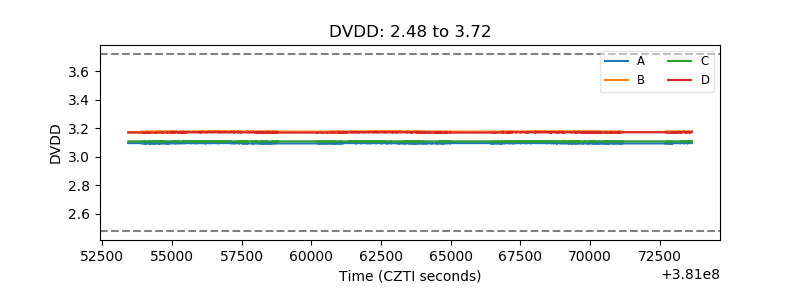 |
| Temperature 1 | 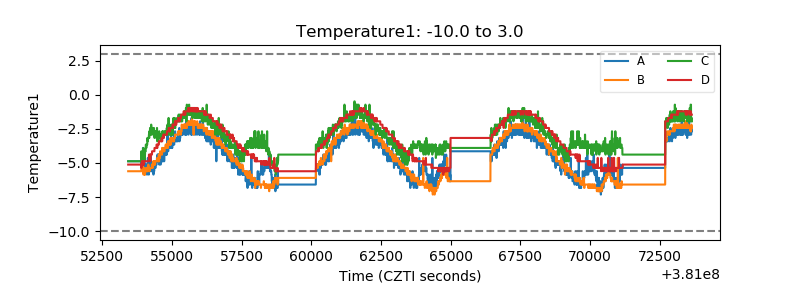 |
| Veto HV Monitor | 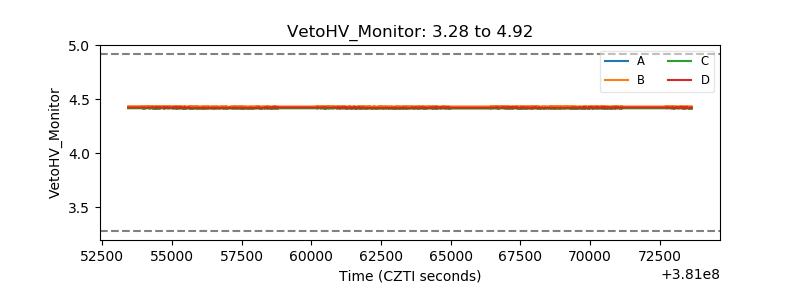 |
| Veto LLD | 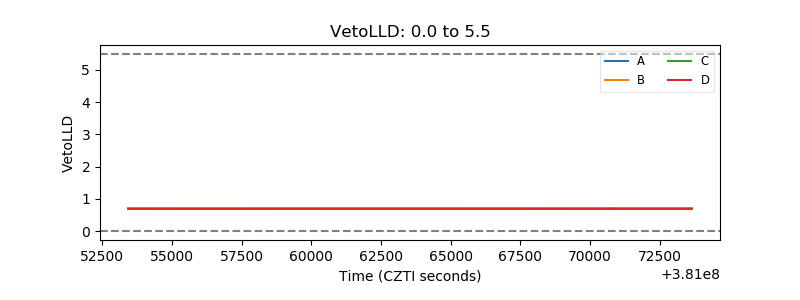 |
| Alpha Counter | 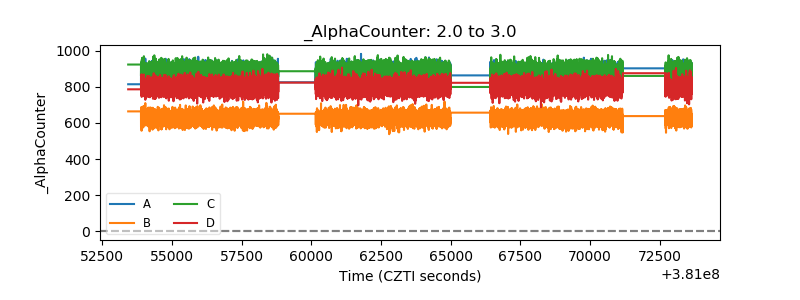 |
| _CPM_Rate | 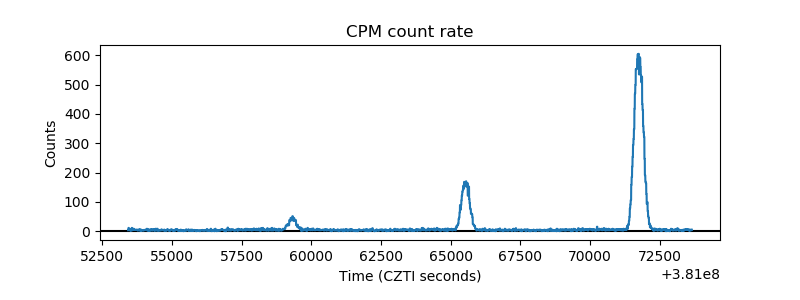 |
| CZT Counter | 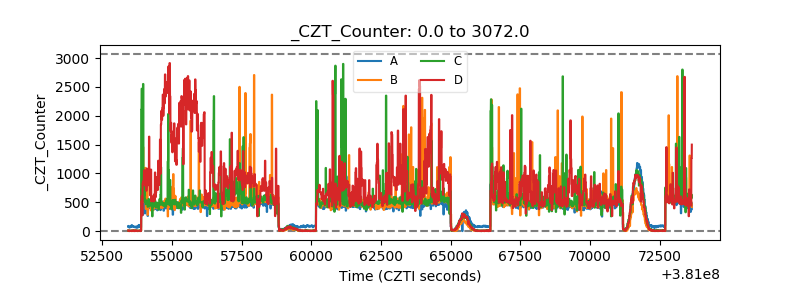 |
| +2.5 Volts monitor | 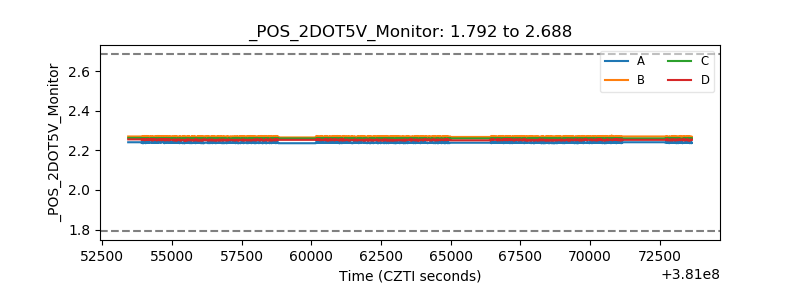 |
| +5 Volts monitor | 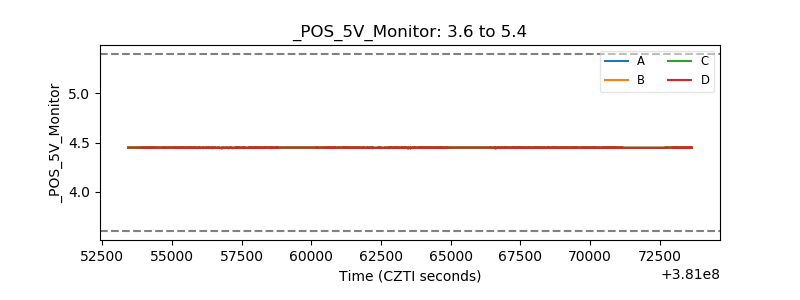 |
| _ROLL_ROT | 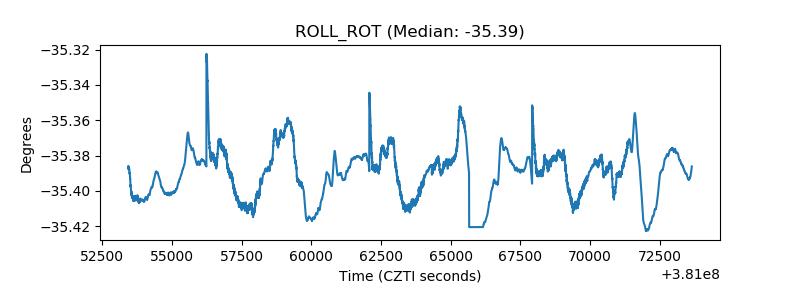 |
| _Roll_DEC | 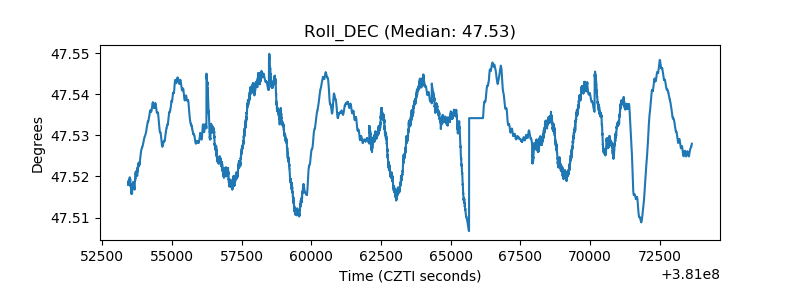 |
| _Roll_RA | 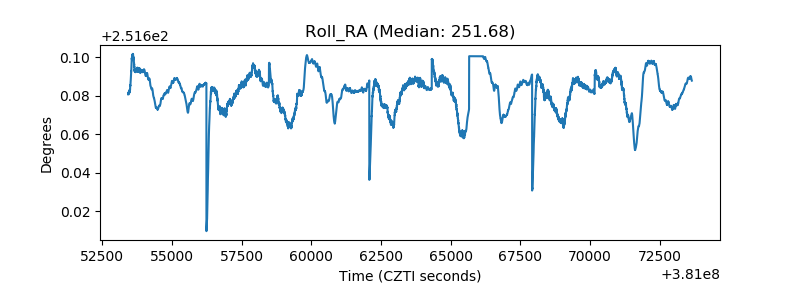 |
| Veto Counter | 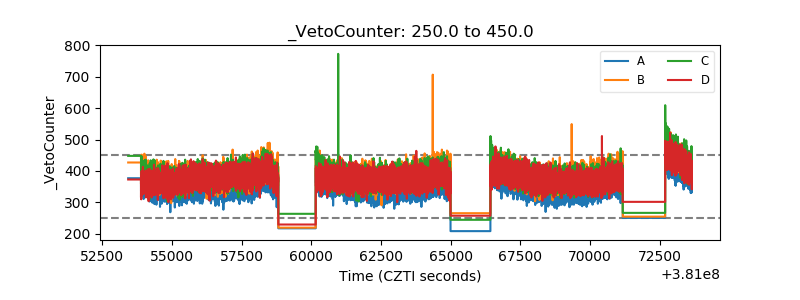 |