| Param | Original file | Final file |
|---|---|---|
| Filename | modeM0/AS1A11_059T09_9000004888cztM0_level2_bc.evt | modeM0/AS1A11_059T09_9000004888cztM0_level2_quad_clean.evt |
| Size (bytes) | 8,315,274,240 | 2,207,341,440 |
| Size | 7.7 GB | 2.1 GB |
| Events in quadrant A | 43,316,440 | 14,127,959 |
| Events in quadrant B | 54,849,090 | 14,282,652 |
| Events in quadrant C | 55,761,302 | 14,029,475 |
| Events in quadrant D | 86,792,238 | 13,205,304 |
| Mode M0 | |||
|---|---|---|---|
| Quadrant | BADHDUFLAG | Total packets | Discarded packets |
| A | 0 | 363366 | 0 |
| B | 0 | 419076 | 0 |
| C | 0 | 396385 | 0 |
| D | 0 | 503865 | 0 |
| Mode SS | |||
|---|---|---|---|
| Quadrant | BADHDUFLAG | Total packets | Discarded packets |
| A | 0 | 3338 | 0 |
| B | 0 | 3338 | 0 |
| C | 0 | 3338 | 0 |
| D | 0 | 3338 | 0 |
| Mode M9 | |||
|---|---|---|---|
| Quadrant | BADHDUFLAG | Total packets | Discarded packets |
| A | 0 | 599 | 0 |
| B | 0 | 599 | 0 |
| C | 0 | 599 | 0 |
| D | 0 | 599 | 0 |
| Quadrant | Total seconds | Saturated seconds | Saturation percentage |
|---|---|---|---|
| A | 163708 | 2409 | 1.471522% |
| B | 163708 | 7986 | 4.878198% |
| C | 163708 | 3845 | 2.348694% |
| D | 163708 | 7170 | 4.379749% |
Noise dominated data is calculated using 1-second bins in cleaned event files. If a bin has >2000 counts, and if more than 50% of those come from <1% of pixels, then it is considered to be noise-dominated and hence unusable.
| Quadrant | # 1 sec bins | Bins with >0 counts | Bins with >2000 counts | High rate bins dominated by noise | Noise dominated (total time) | Noise dominated (detector-on time) | Marked lightcurve |
|---|---|---|---|---|---|---|---|
| A | 223122 | 163731 | 632 | 632 | 0.28% | 0.39% | 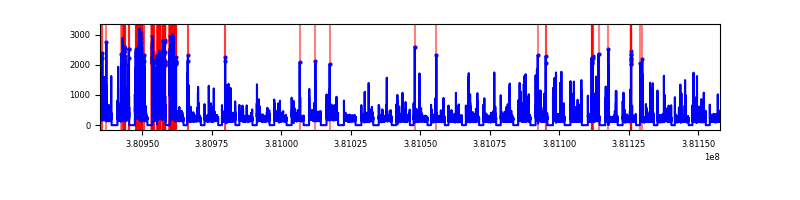 |
| B | 223121 | 163700 | 374 | 374 | 0.17% | 0.23% | 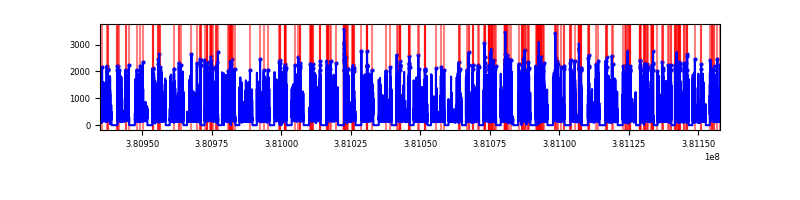 |
| C | 223121 | 163641 | 799 | 799 | 0.36% | 0.49% | 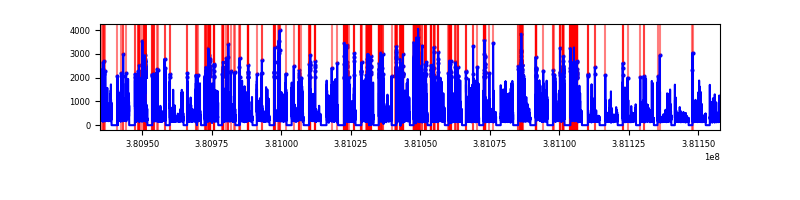 |
| D | 223121 | 163703 | 1986 | 1986 | 0.89% | 1.21% | 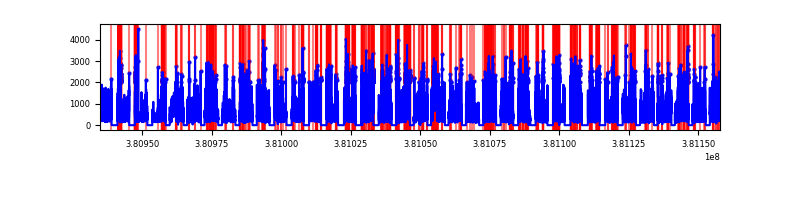 |
Top three noisy pixels from each quadrant. If the there are fewer than three noisy pixels in the level2.evt file, extra rows are filled as -1
| Pixel properties | Quadrant properties | ||||||
|---|---|---|---|---|---|---|---|
| Quadrant | DetID | PixID | Counts | Sigma | Mean | Median | Sigma |
| A | 15 | 169 | 7810566 | 4167.33 | 8531 | 8394 | 1872.2 |
| A | 9 | 143 | 801652 | 423.7 | 8531 | 8394 | 1872.2 |
| A | 15 | 47 | 777344 | 410.72 | 8531 | 8394 | 1872.2 |
| B | 5 | 172 | 15416030 | 9202.21 | 8514 | 8344 | 1674.3 |
| B | 0 | 189 | 1706702 | 1014.34 | 8514 | 8344 | 1674.3 |
| B | 0 | 229 | 1085029 | 643.05 | 8514 | 8344 | 1674.3 |
| C | 15 | 214 | 6667395 | 3531.13 | 8324 | 8287 | 1885.8 |
| C | 14 | 254 | 4804715 | 2543.4 | 8324 | 8287 | 1885.8 |
| C | 0 | 207 | 4038616 | 2137.16 | 8324 | 8287 | 1885.8 |
| D | 8 | 195 | 30075954 | 14989.73 | 8300 | 8047 | 2005.9 |
| D | 7 | 80 | 7534927 | 3752.37 | 8300 | 8047 | 2005.9 |
| D | 7 | 223 | 3239702 | 1611.07 | 8300 | 8047 | 2005.9 |
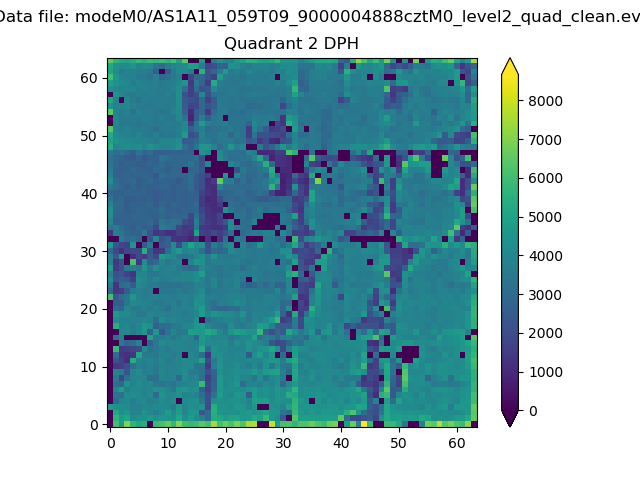
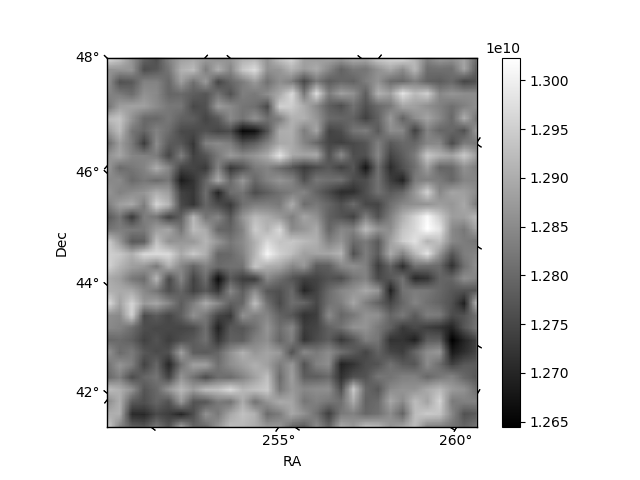
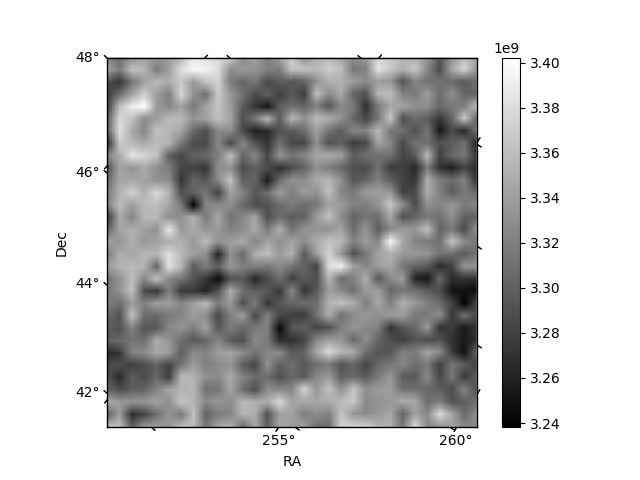
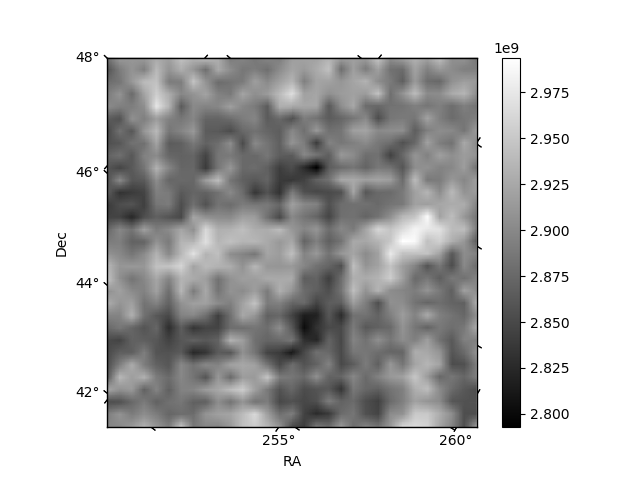
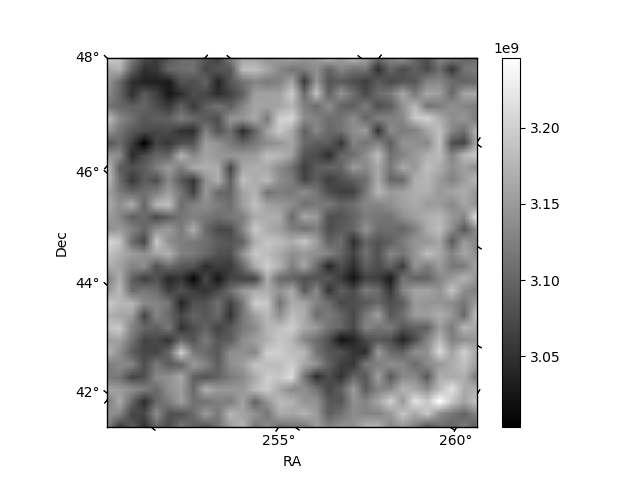
Histogram calculated using DETX and DETY for each event in the final _common_clean file
| Quadrant A | 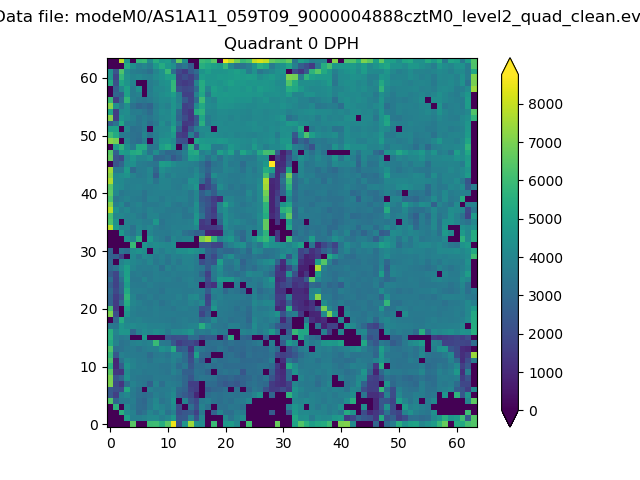 |
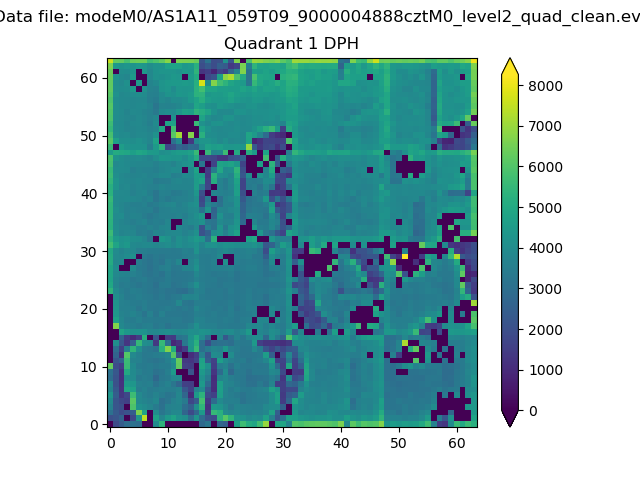 |
Quadrant B |
|---|---|---|---|
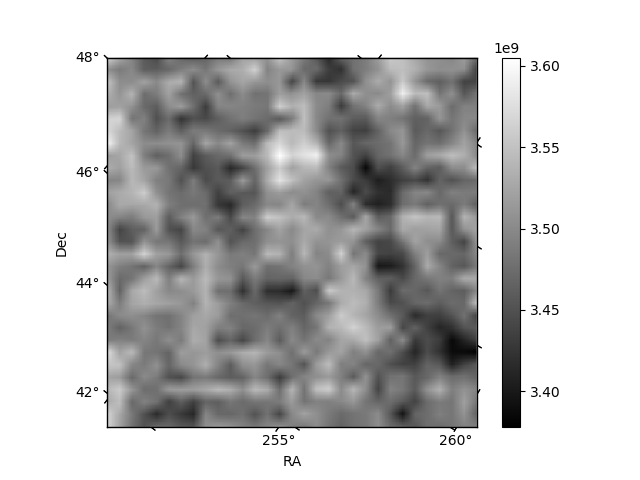
| Quadrant D | 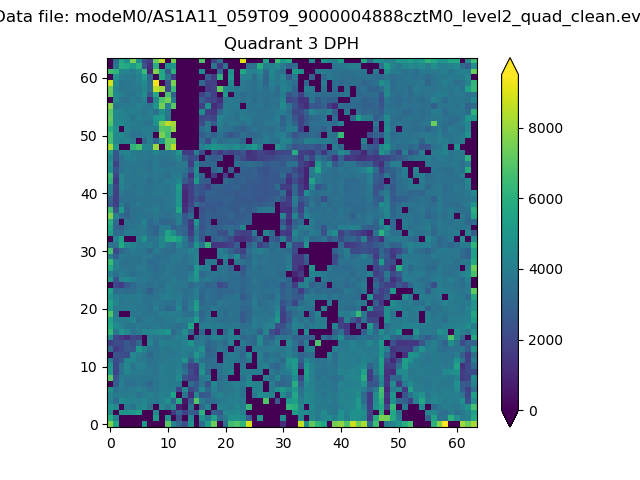 |
 |
Quadrant C |
| Plot type | Count rate plots | Images |
|---|---|---|
| Comparison with Poisson distribution Blue bars denote a histogram of data divided into 1 sec bins. Red curve is a Poisson curve with rate = median count rate of data. |
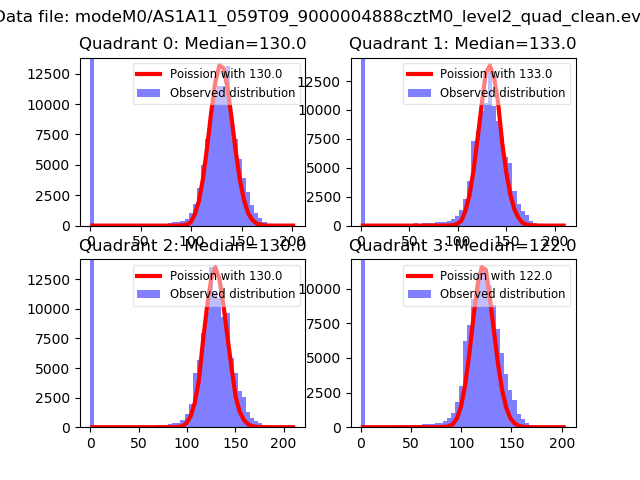 |
 |
| Quadrant-wise count rates Data is divided into 100 sec bins |
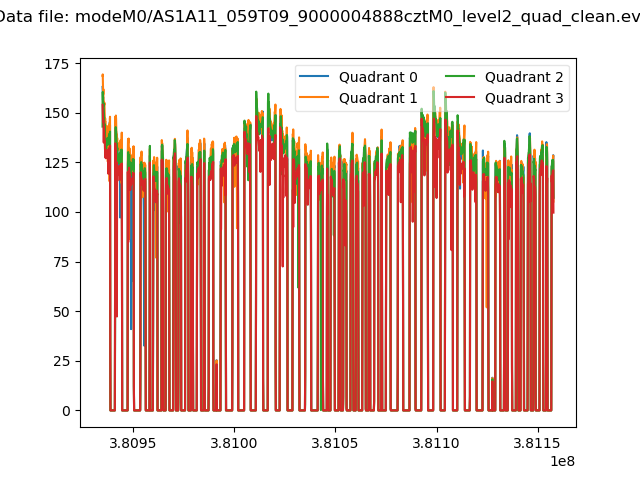 |
|
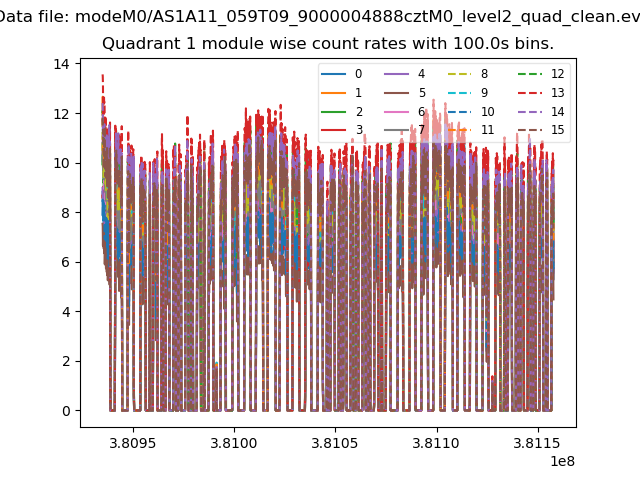
| Module-wise count rates for Quadrant A Data is divided into 100 sec bins |
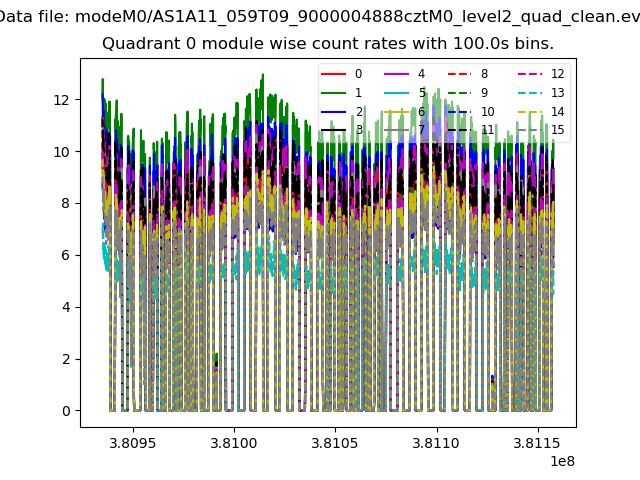 |
 |
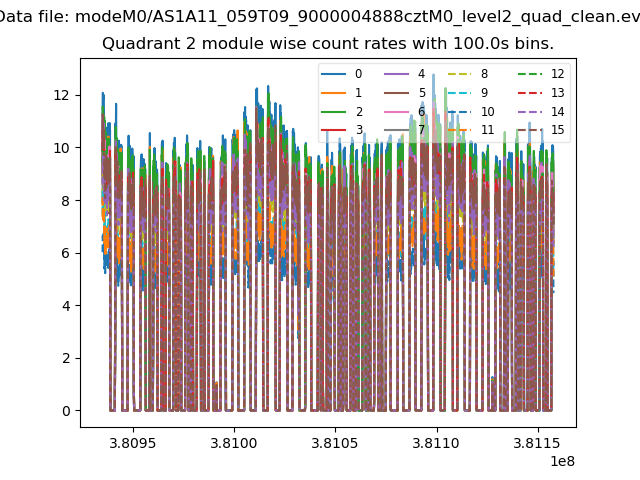
| Module-wise count rates for Quadrant B Data is divided into 100 sec bins |
 |
 |
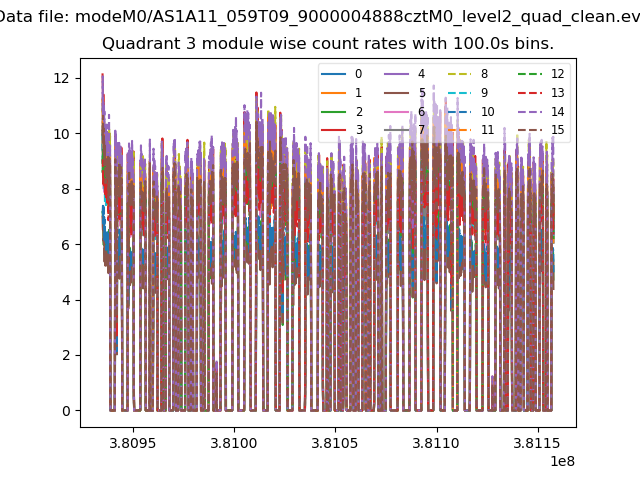
| Module-wise count rates for Quadrant C Data is divided into 100 sec bins |
 |
 |
| Module-wise count rates for Quadrant D Data is divided into 100 sec bins |
 |
 |
| Parameter | Plot |
|---|---|
| CZT HV Monitor | 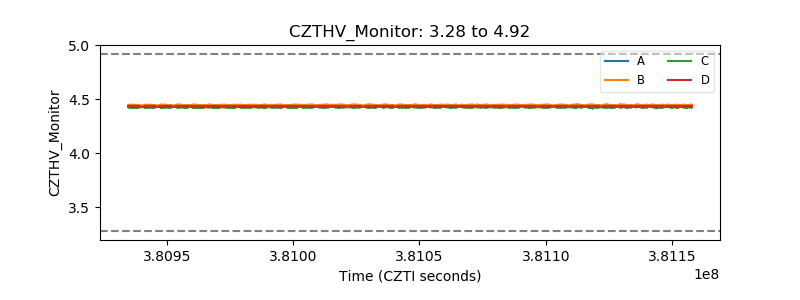 |
| D_VDD | 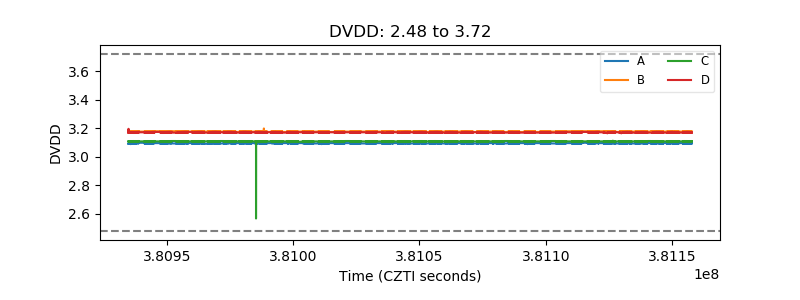 |
| Temperature 1 | 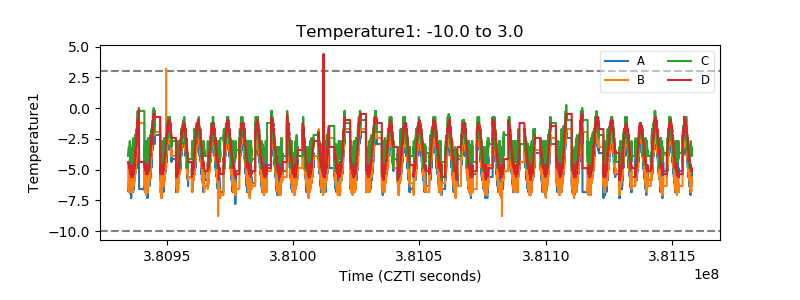 |
| Veto HV Monitor | 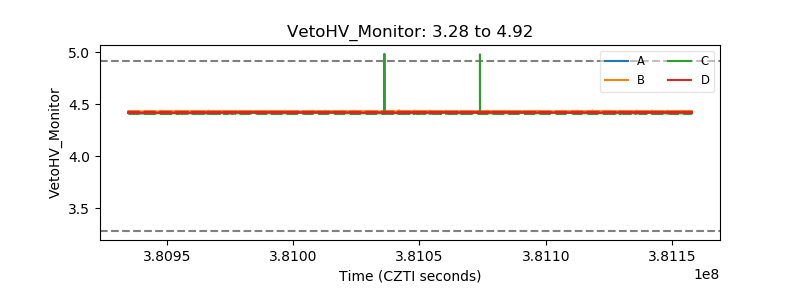 |
| Veto LLD | 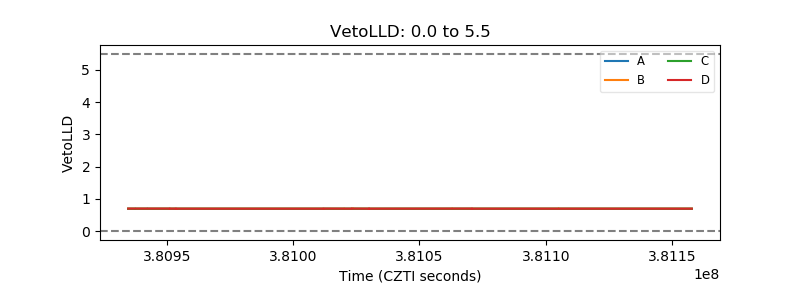 |
| Alpha Counter | 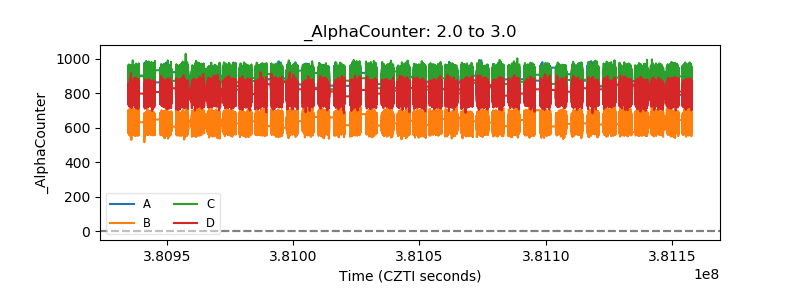 |
| _CPM_Rate | 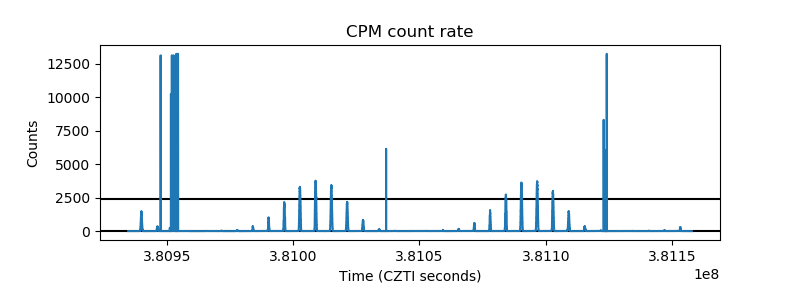 |
| CZT Counter | 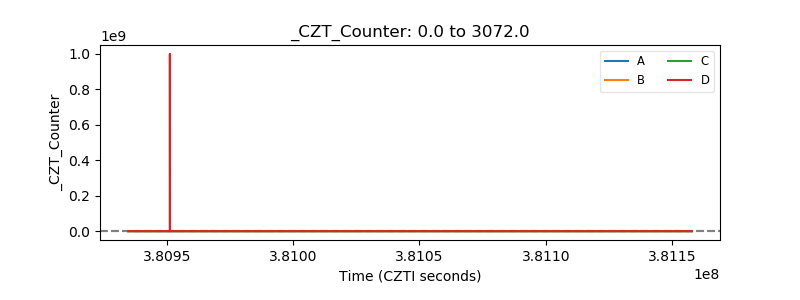 |
| +2.5 Volts monitor | 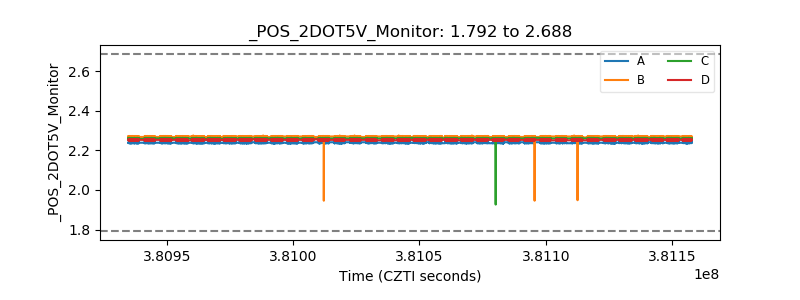 |
| +5 Volts monitor | 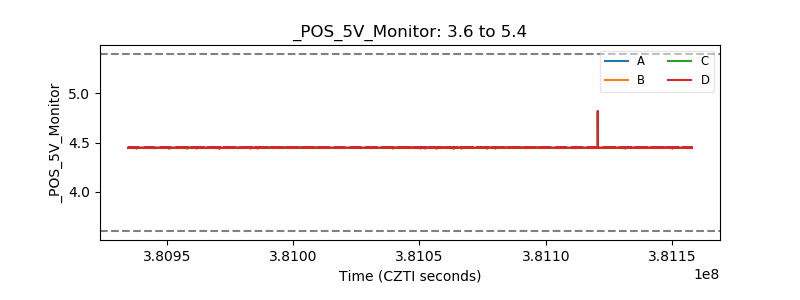 |
| _ROLL_ROT | 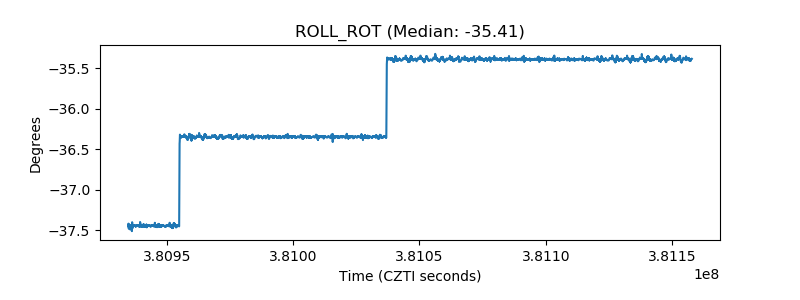 |
| _Roll_DEC | 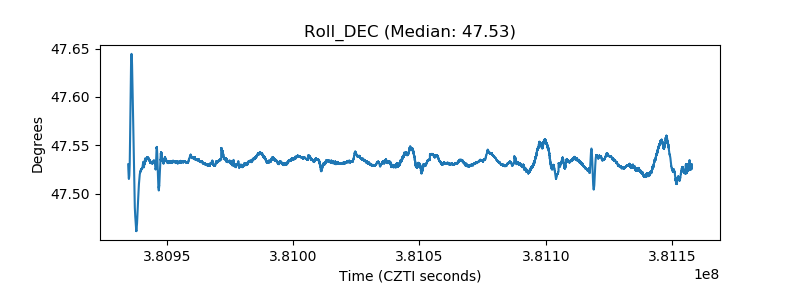 |
| _Roll_RA | 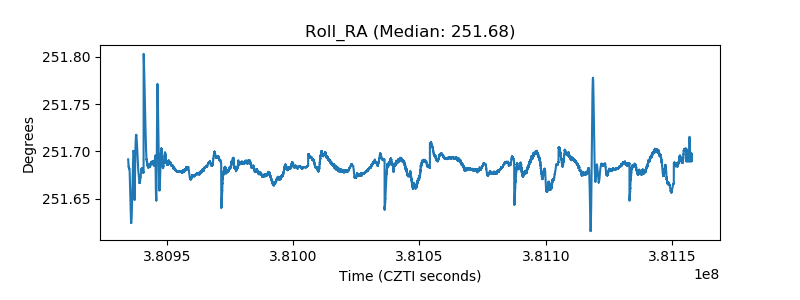 |
| Veto Counter | 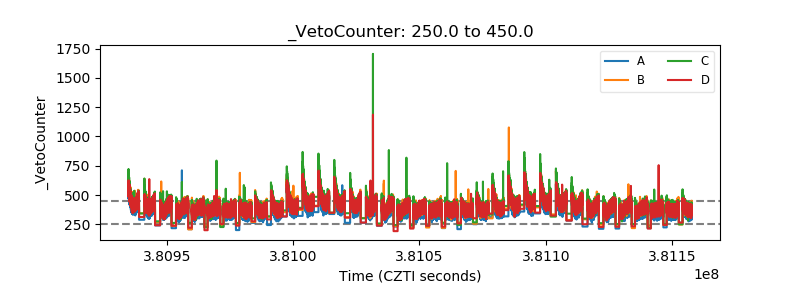 |