| Param | Original file | Final file |
|---|---|---|
| Filename | modeM0/AS1T04_086T01_9000004884_34206cztM0_level2.evt | modeM0/AS1T04_086T01_9000004884_34206cztM0_level2_quad_clean.evt |
| Size (bytes) | 677,836,800 | 51,027,840 |
| Size | 646.4 MB | 48.7 MB |
| Events in quadrant A | 2,669,455 | 317,169 |
| Events in quadrant B | 7,270,954 | 272,839 |
| Events in quadrant C | 3,000,510 | 331,582 |
| Events in quadrant D | 7,244,227 | 265,749 |
| Mode SS | |||
|---|---|---|---|
| Quadrant | BADHDUFLAG | Total packets | Discarded packets |
| A | 0 | 104 | 0 |
| B | 0 | 104 | 0 |
| C | 0 | 104 | 0 |
| D | 0 | 104 | 0 |
| Mode M9 | |||
|---|---|---|---|
| Quadrant | BADHDUFLAG | Total packets | Discarded packets |
| A | 0 | 26 | 0 |
| B | 0 | 26 | 0 |
| C | 0 | 26 | 0 |
| D | 0 | 27 | 0 |
| Mode M0 | |||
|---|---|---|---|
| Quadrant | BADHDUFLAG | Total packets | Discarded packets |
| A | 0 | 10880 | 3 |
| B | 0 | 25051 | 2 |
| C | 0 | 11644 | 2 |
| D | 0 | 25031 | 2 |
| Quadrant | Total seconds | Saturated seconds | Saturation percentage |
|---|---|---|---|
| A | 5085 | 13 | 0.255654% |
| B | 5085 | 1686 | 33.156342% |
| C | 5085 | 84 | 1.651917% |
| D | 5085 | 1306 | 25.683382% |
Noise dominated data is calculated using 1-second bins in cleaned event files. If a bin has >2000 counts, and if more than 50% of those come from <1% of pixels, then it is considered to be noise-dominated and hence unusable.
| Quadrant | # 1 sec bins | Bins with >0 counts | Bins with >2000 counts | High rate bins dominated by noise | Noise dominated (total time) | Noise dominated (detector-on time) | Marked lightcurve |
|---|---|---|---|---|---|---|---|
| A | 7237 | 5086 | 3 | 3 | 0.04% | 0.06% | 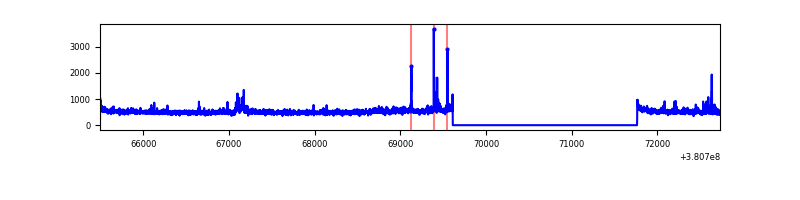 |
| B | 7237 | 5086 | 1348 | 1348 | 18.63% | 26.50% | 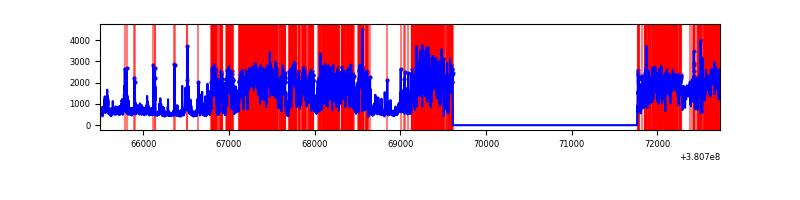 |
| C | 7237 | 5086 | 59 | 59 | 0.82% | 1.16% | 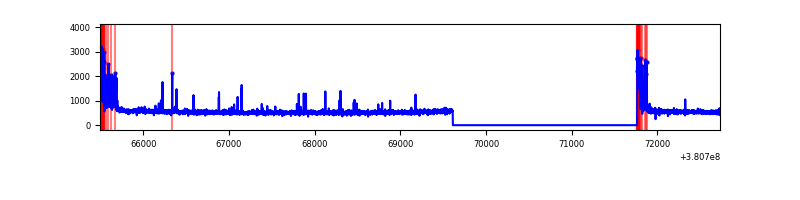 |
| D | 7237 | 5086 | 1162 | 1162 | 16.06% | 22.85% | 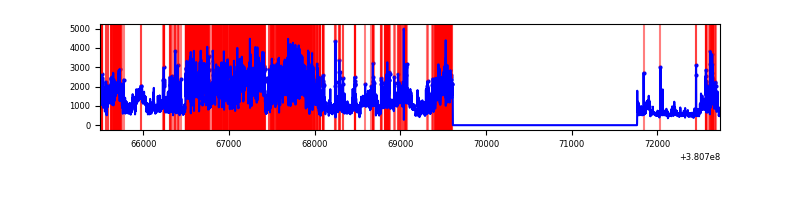 |
Top three noisy pixels from each quadrant. If the there are fewer than three noisy pixels in the level2.evt file, extra rows are filled as -1
| Pixel properties | Quadrant properties | ||||||
|---|---|---|---|---|---|---|---|
| Quadrant | DetID | PixID | Counts | Sigma | Mean | Median | Sigma |
| A | 15 | 169 | 163358 | 1298.53 | 631 | 621 | 125.3 |
| A | 9 | 143 | 27477 | 214.29 | 631 | 621 | 125.3 |
| A | 10 | 83 | 21728 | 168.42 | 631 | 621 | 125.3 |
| B | 5 | 31 | 2996484 | 27426.36 | 577 | 564 | 109.2 |
| B | 5 | 15 | 1128598 | 10326.67 | 577 | 564 | 109.2 |
| B | 5 | 172 | 404302 | 3696.05 | 577 | 564 | 109.2 |
| C | 0 | 10 | 313314 | 2205.2 | 620 | 626 | 141.8 |
| C | 15 | 214 | 237087 | 1667.61 | 620 | 626 | 141.8 |
| C | 15 | 159 | 14573 | 98.36 | 620 | 626 | 141.8 |
| D | 2 | 250 | 2379819 | 17307.38 | 565 | 551 | 137.5 |
| D | 12 | 217 | 961372 | 6989.25 | 565 | 551 | 137.5 |
| D | 8 | 195 | 866786 | 6301.21 | 565 | 551 | 137.5 |
Histogram calculated using DETX and DETY for each event in the final _common_clean file
| Quadrant A | 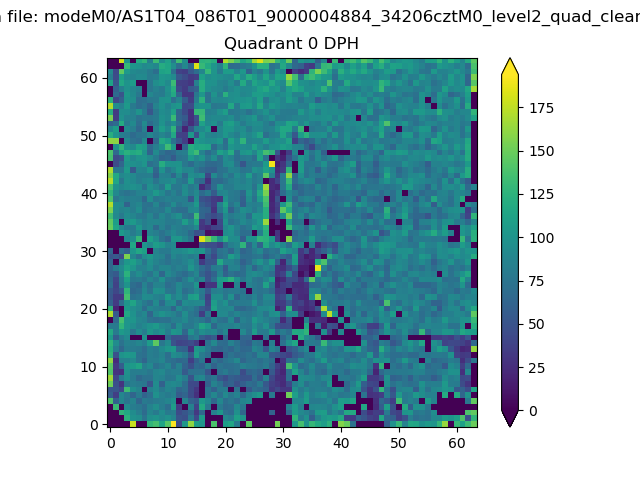 |
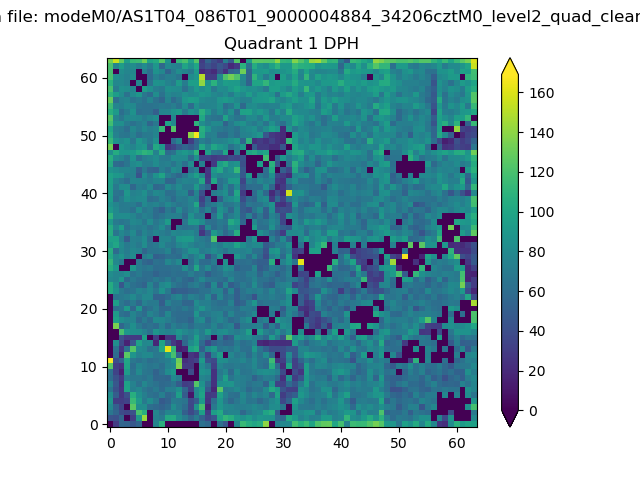 |
Quadrant B |
|---|---|---|---|
| Quadrant D | 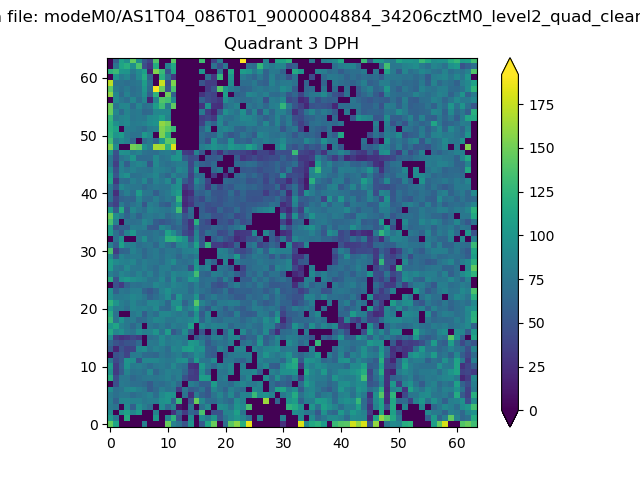 |
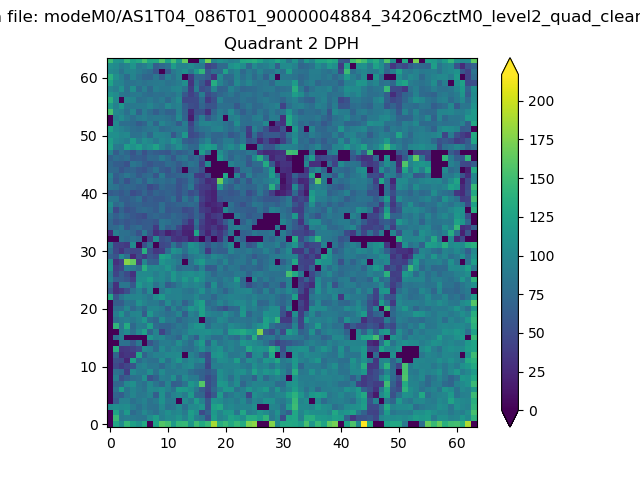 |
Quadrant C |
| Plot type | Count rate plots | Images |
|---|---|---|
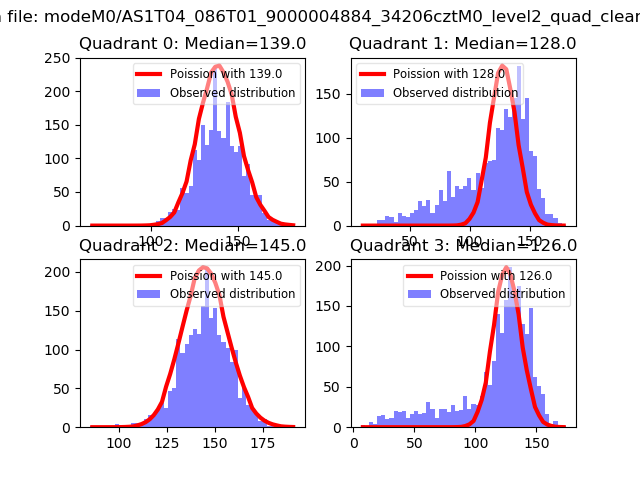
| Comparison with Poisson distribution Blue bars denote a histogram of data divided into 1 sec bins. Red curve is a Poisson curve with rate = median count rate of data. |
 |
 |
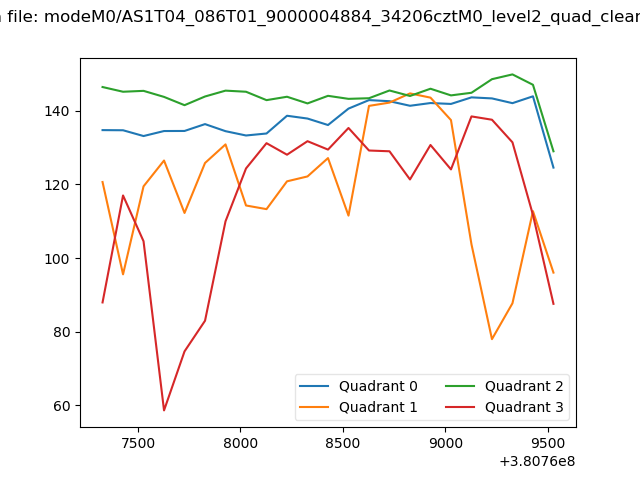
| Quadrant-wise count rates Data is divided into 100 sec bins |
 |
|
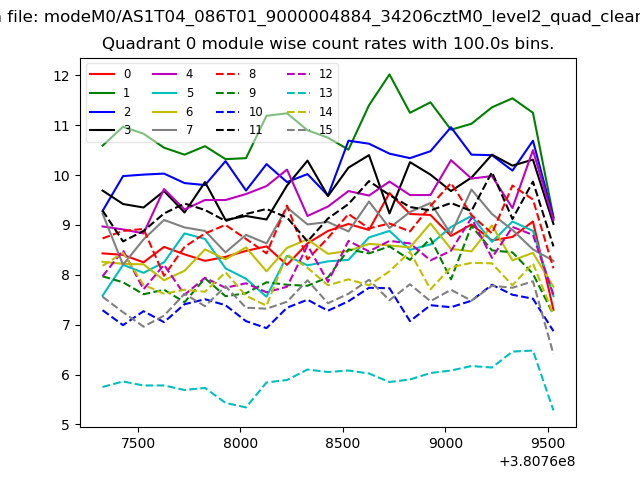
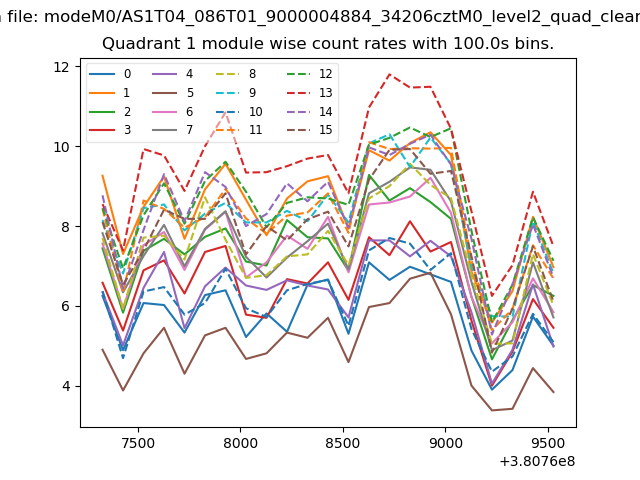
| Module-wise count rates for Quadrant A Data is divided into 100 sec bins |
 |
 |
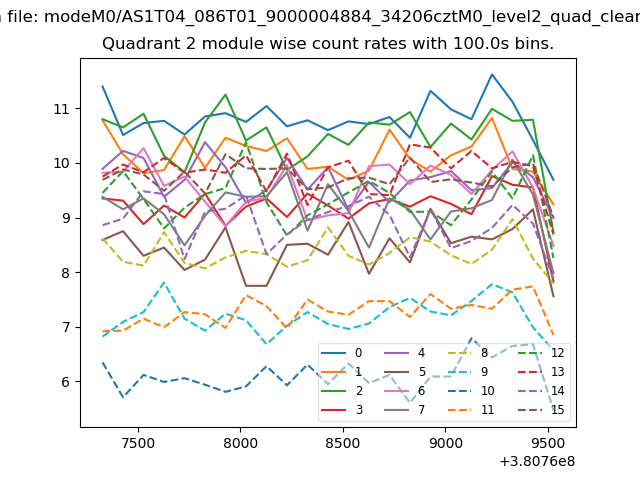
| Module-wise count rates for Quadrant B Data is divided into 100 sec bins |
 |
 |
| Module-wise count rates for Quadrant C Data is divided into 100 sec bins |
 |
 |
| Module-wise count rates for Quadrant D Data is divided into 100 sec bins |
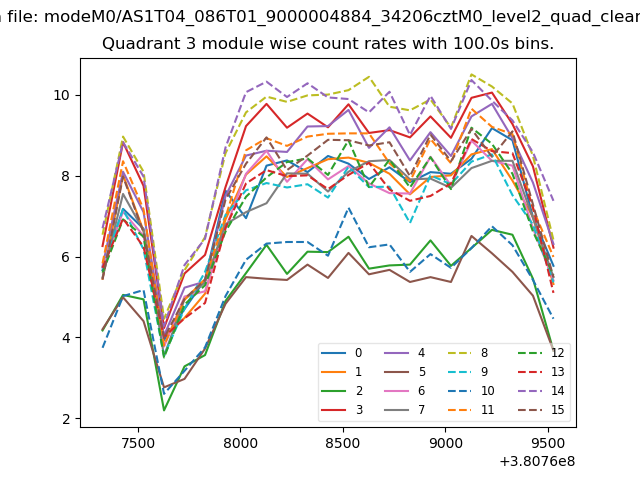 |
 |
| Parameter | Plot |
|---|---|
| CZT HV Monitor | 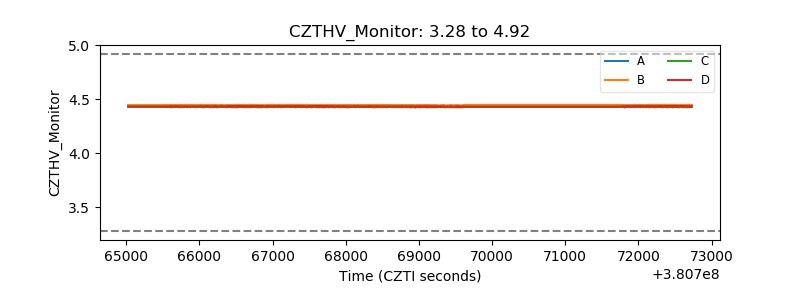 |
| D_VDD | 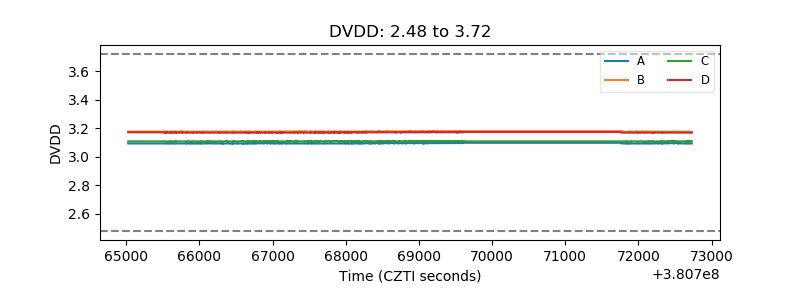 |
| Temperature 1 | 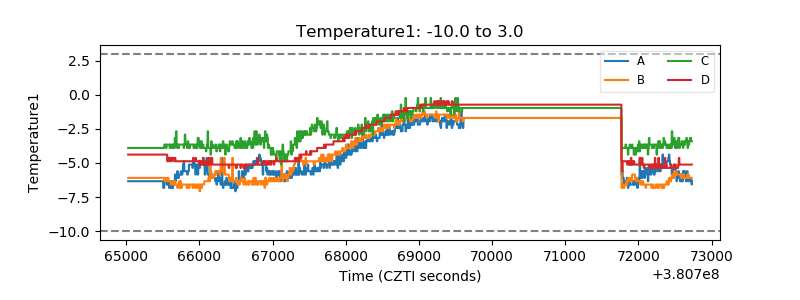 |
| Veto HV Monitor | 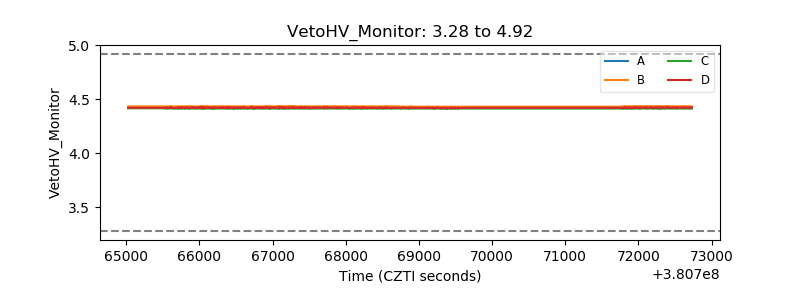 |
| Veto LLD | 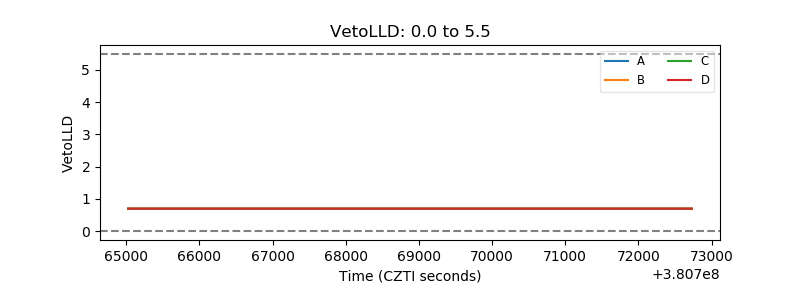 |
| Alpha Counter | 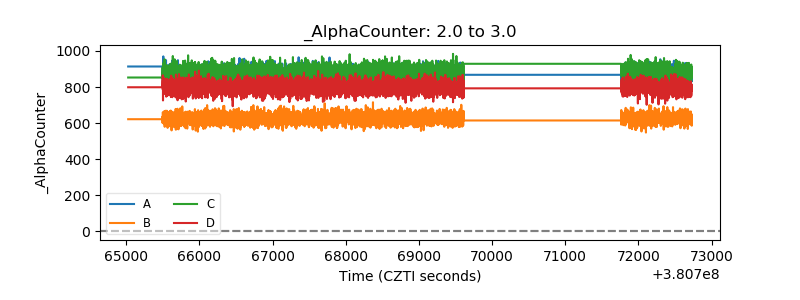 |
| _CPM_Rate | 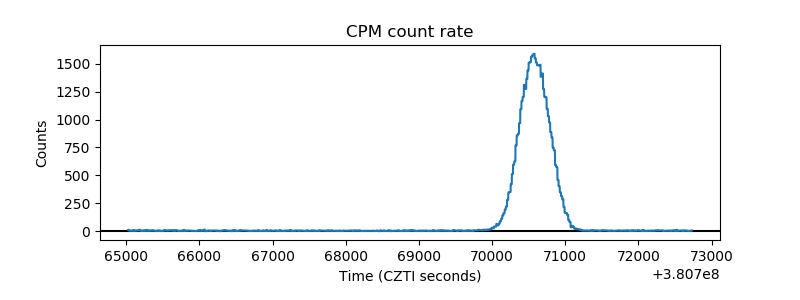 |
| CZT Counter | 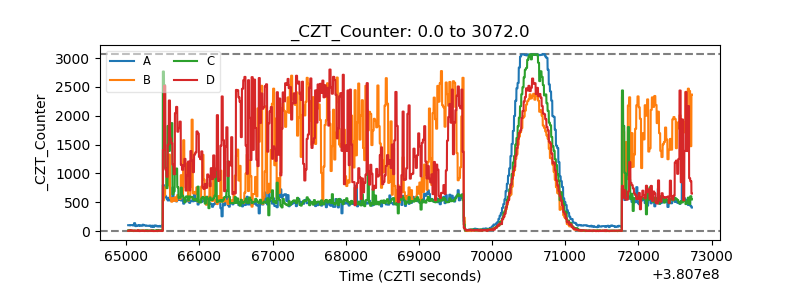 |
| +2.5 Volts monitor |  |
| +5 Volts monitor | 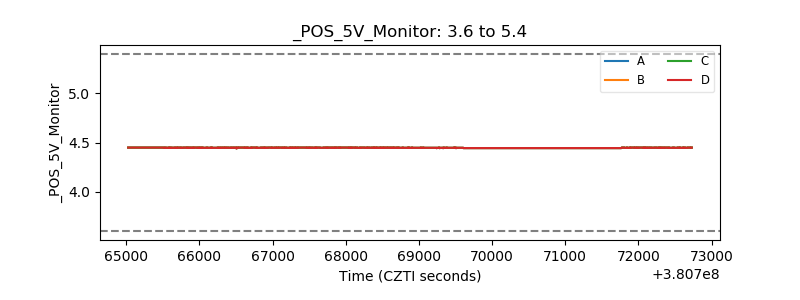 |
| _ROLL_ROT | 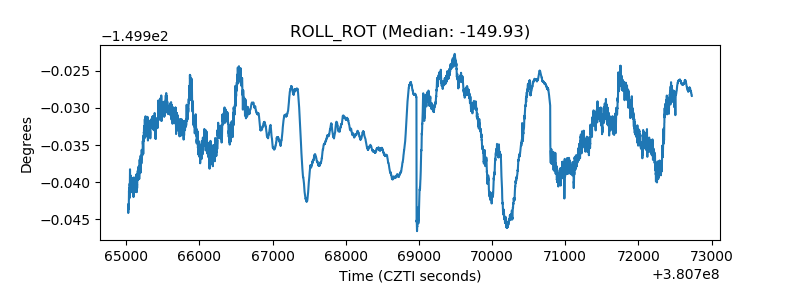 |
| _Roll_DEC | 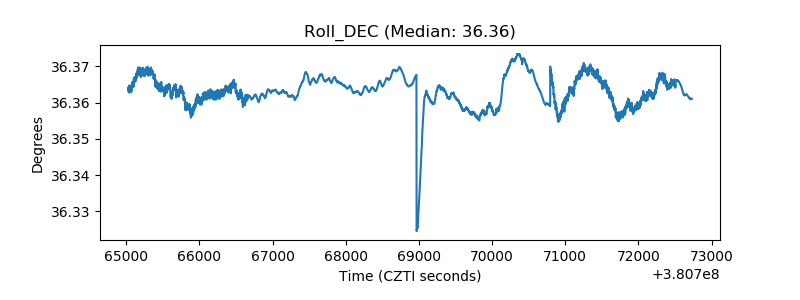 |
| _Roll_RA | 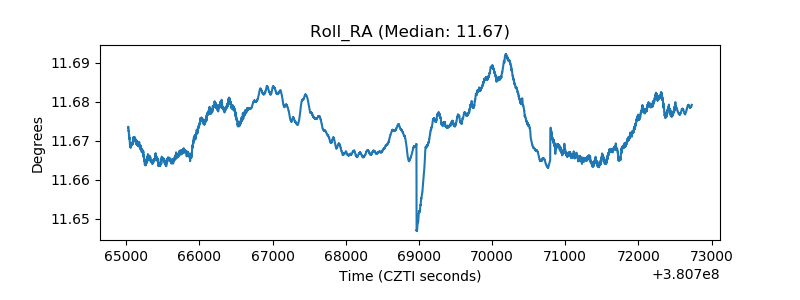 |
| Veto Counter | 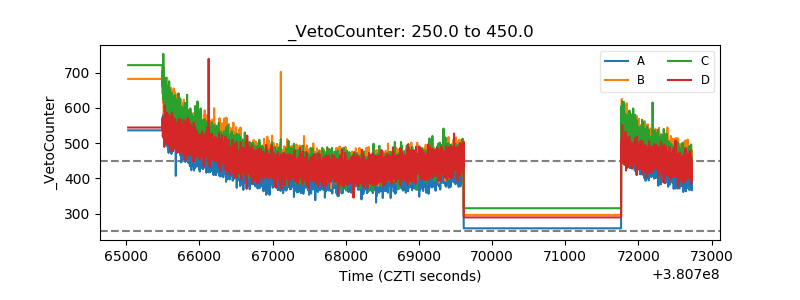 |