| Param | Original file | Final file |
|---|---|---|
| Filename | modeM0/AS1A11_047T15_9000004882_34205cztM0_level2.evt | modeM0/AS1A11_047T15_9000004882_34205cztM0_level2_quad_clean.evt |
| Size (bytes) | 651,646,080 | 83,494,080 |
| Size | 621.5 MB | 79.6 MB |
| Events in quadrant A | 2,631,578 | 570,393 |
| Events in quadrant B | 7,315,487 | 520,351 |
| Events in quadrant C | 3,274,385 | 574,796 |
| Events in quadrant D | 6,173,281 | 508,643 |
| Mode SS | |||
|---|---|---|---|
| Quadrant | BADHDUFLAG | Total packets | Discarded packets |
| A | 0 | 102 | 0 |
| B | 0 | 102 | 0 |
| C | 0 | 102 | 0 |
| D | 0 | 102 | 0 |
| Mode M9 | |||
|---|---|---|---|
| Quadrant | BADHDUFLAG | Total packets | Discarded packets |
| A | 0 | 28 | 0 |
| B | 0 | 28 | 0 |
| C | 0 | 28 | 0 |
| D | 0 | 29 | 0 |
| Mode M0 | |||
|---|---|---|---|
| Quadrant | BADHDUFLAG | Total packets | Discarded packets |
| A | 0 | 10876 | 1 |
| B | 0 | 25100 | 1 |
| C | 0 | 12838 | 1 |
| D | 0 | 21861 | 1 |
| Quadrant | Total seconds | Saturated seconds | Saturation percentage |
|---|---|---|---|
| A | 5045 | 10 | 0.198216% |
| B | 5045 | 2037 | 40.376611% |
| C | 5045 | 196 | 3.885035% |
| D | 5045 | 610 | 12.091179% |
Noise dominated data is calculated using 1-second bins in cleaned event files. If a bin has >2000 counts, and if more than 50% of those come from <1% of pixels, then it is considered to be noise-dominated and hence unusable.
| Quadrant | # 1 sec bins | Bins with >0 counts | Bins with >2000 counts | High rate bins dominated by noise | Noise dominated (total time) | Noise dominated (detector-on time) | Marked lightcurve |
|---|---|---|---|---|---|---|---|
| A | 7078 | 5046 | 5 | 5 | 0.07% | 0.10% | 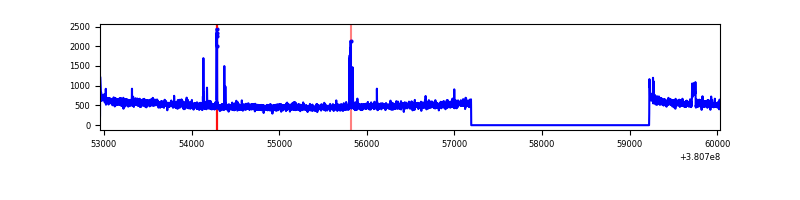 |
| B | 7078 | 5046 | 1796 | 1796 | 25.37% | 35.59% | 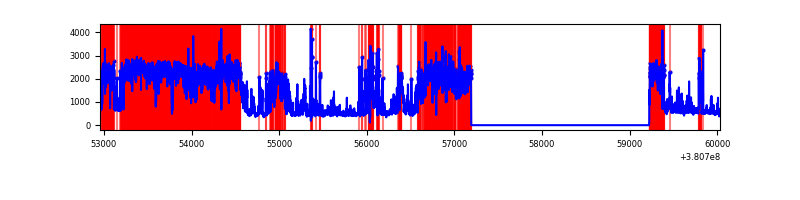 |
| C | 7078 | 5046 | 130 | 130 | 1.84% | 2.58% | 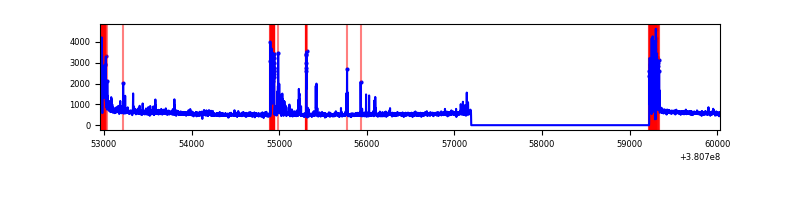 |
| D | 7078 | 5046 | 525 | 525 | 7.42% | 10.40% | 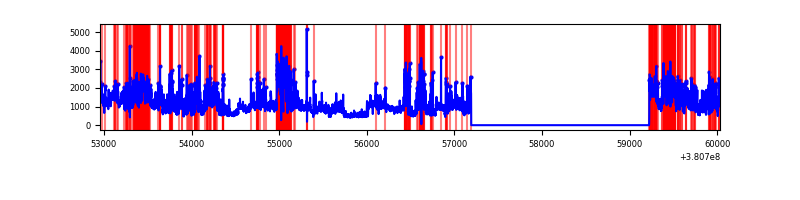 |
Top three noisy pixels from each quadrant. If the there are fewer than three noisy pixels in the level2.evt file, extra rows are filled as -1
| Pixel properties | Quadrant properties | ||||||
|---|---|---|---|---|---|---|---|
| Quadrant | DetID | PixID | Counts | Sigma | Mean | Median | Sigma |
| A | 15 | 169 | 66780 | 512.12 | 646 | 636 | 129.2 |
| A | 9 | 143 | 25292 | 190.9 | 646 | 636 | 129.2 |
| A | 10 | 83 | 23192 | 174.64 | 646 | 636 | 129.2 |
| B | 5 | 31 | 1783425 | 17043.26 | 561 | 550 | 104.6 |
| B | 5 | 15 | 1611273 | 15397.59 | 561 | 550 | 104.6 |
| B | 5 | 14 | 859733 | 8213.3 | 561 | 550 | 104.6 |
| C | 0 | 10 | 432698 | 3007.92 | 624 | 631 | 143.6 |
| C | 15 | 214 | 226881 | 1575.08 | 624 | 631 | 143.6 |
| C | 9 | 187 | 120498 | 834.48 | 624 | 631 | 143.6 |
| D | 8 | 195 | 1474578 | 9471.18 | 601 | 589 | 155.6 |
| D | 12 | 217 | 1197055 | 7687.95 | 601 | 589 | 155.6 |
| D | 10 | 118 | 506633 | 3251.61 | 601 | 589 | 155.6 |
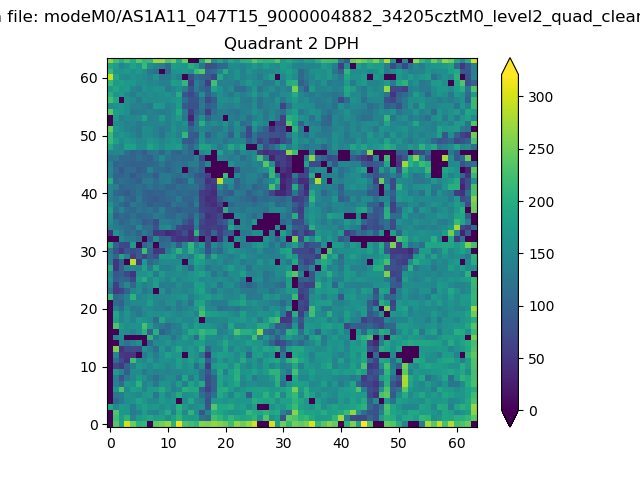
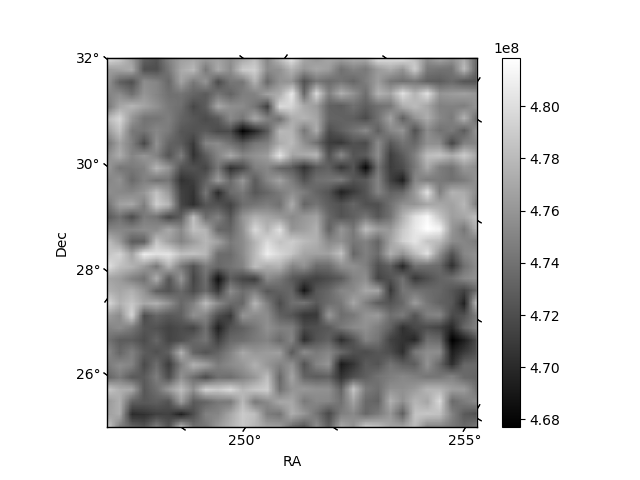
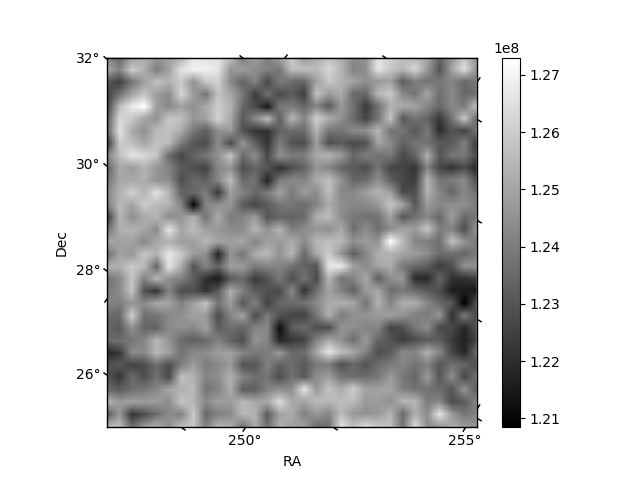
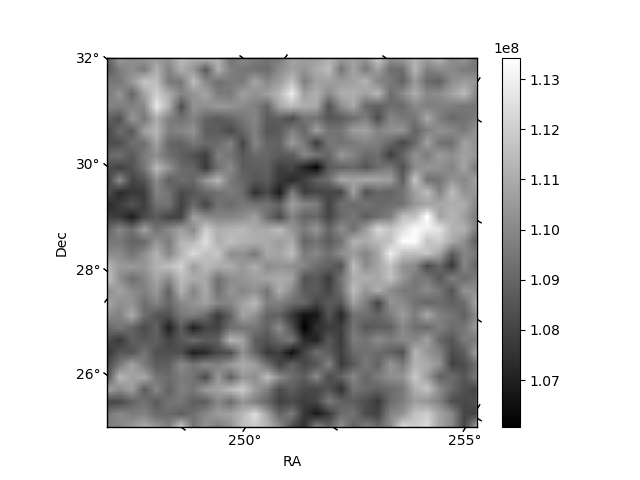
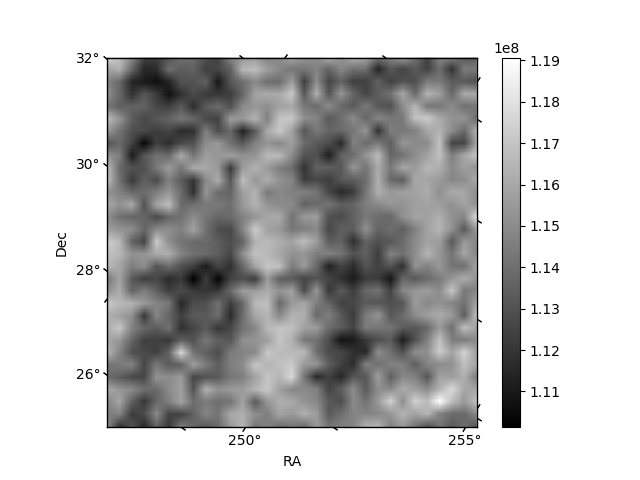
Histogram calculated using DETX and DETY for each event in the final _common_clean file
| Quadrant A | 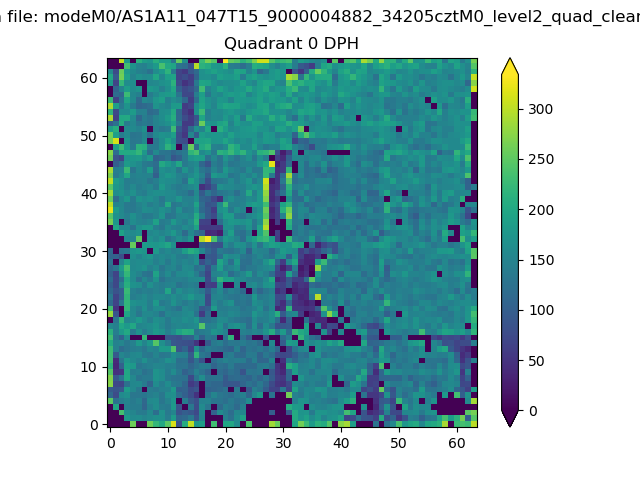 |
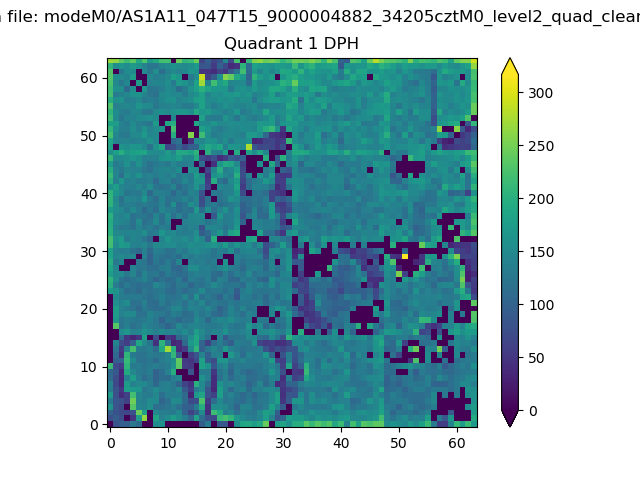 |
Quadrant B |
|---|---|---|---|
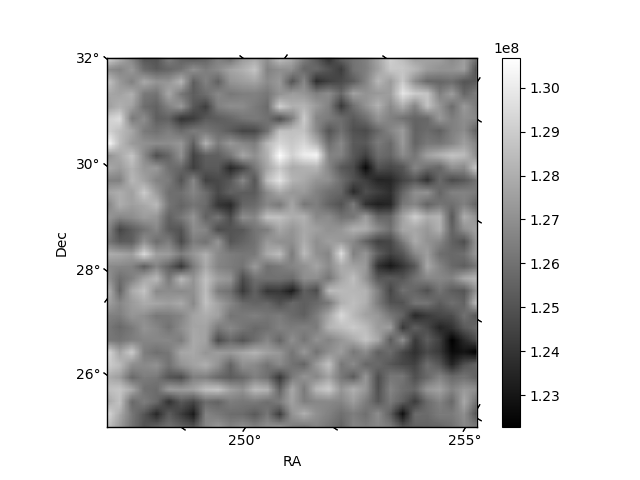
| Quadrant D | 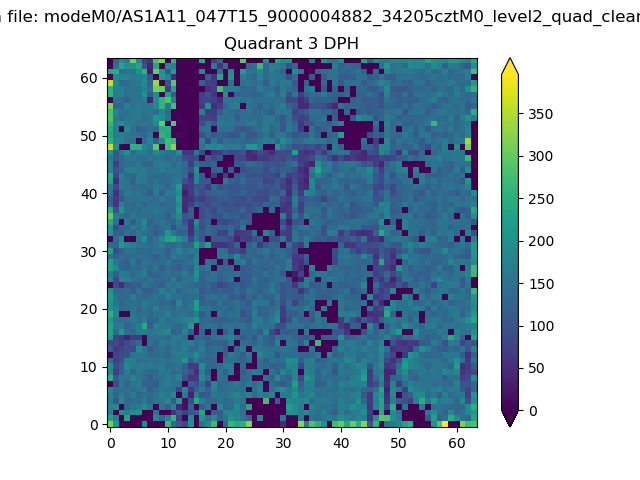 |
 |
Quadrant C |
| Plot type | Count rate plots | Images |
|---|---|---|
| Comparison with Poisson distribution Blue bars denote a histogram of data divided into 1 sec bins. Red curve is a Poisson curve with rate = median count rate of data. |
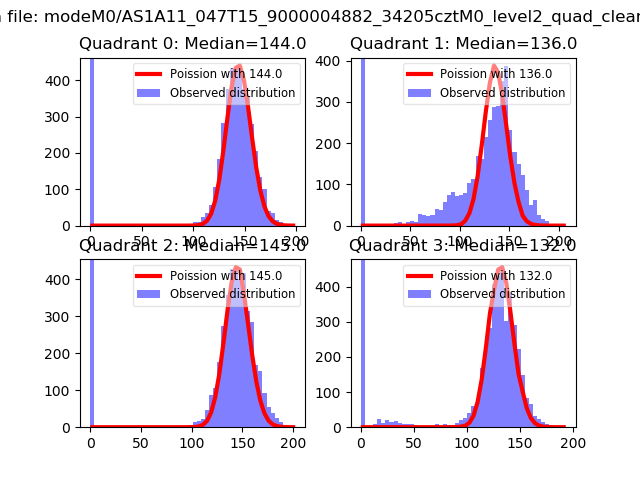 |
 |
| Quadrant-wise count rates Data is divided into 100 sec bins |
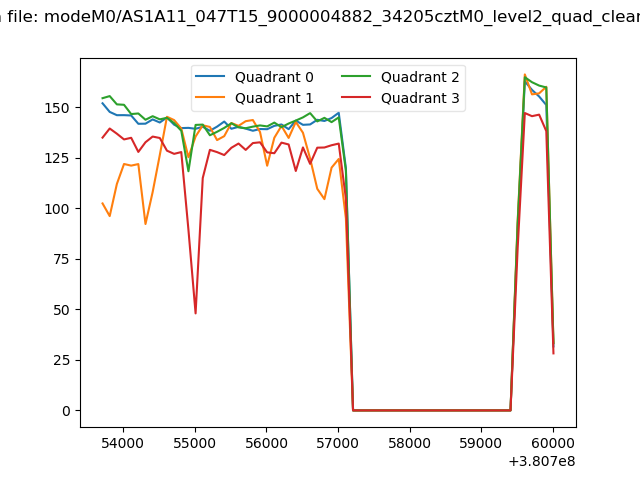 |
|
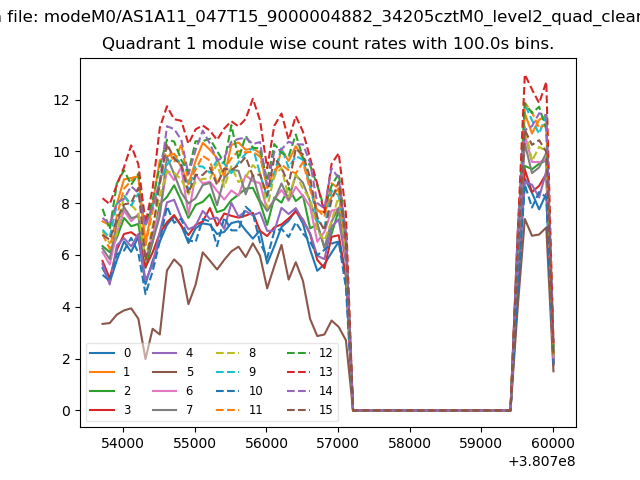
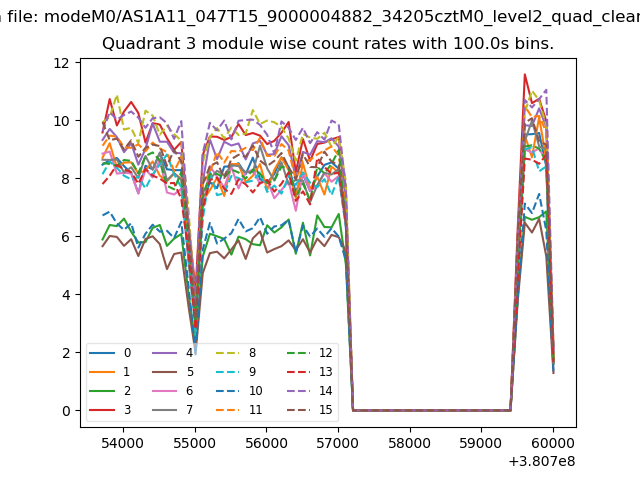
| Module-wise count rates for Quadrant A Data is divided into 100 sec bins |
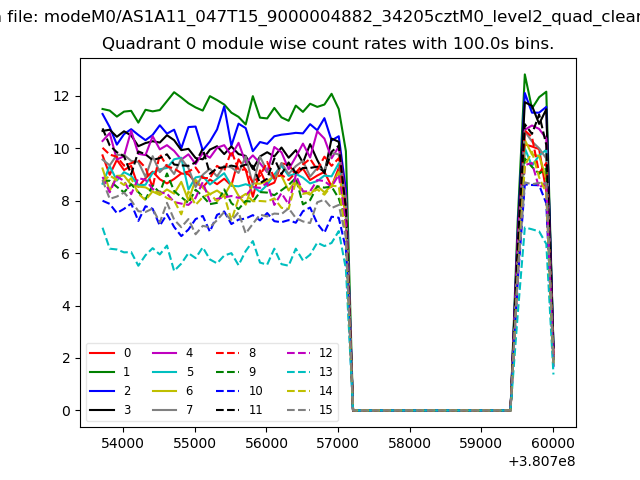 |
 |
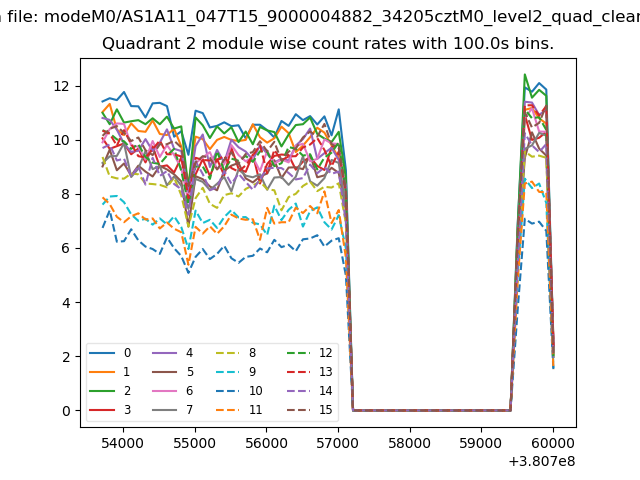
| Module-wise count rates for Quadrant B Data is divided into 100 sec bins |
 |
 |
| Module-wise count rates for Quadrant C Data is divided into 100 sec bins |
 |
 |
| Module-wise count rates for Quadrant D Data is divided into 100 sec bins |
 |
 |
| Parameter | Plot |
|---|---|
| CZT HV Monitor | 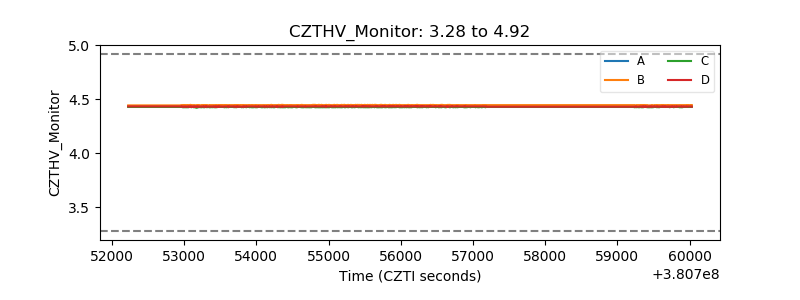 |
| D_VDD | 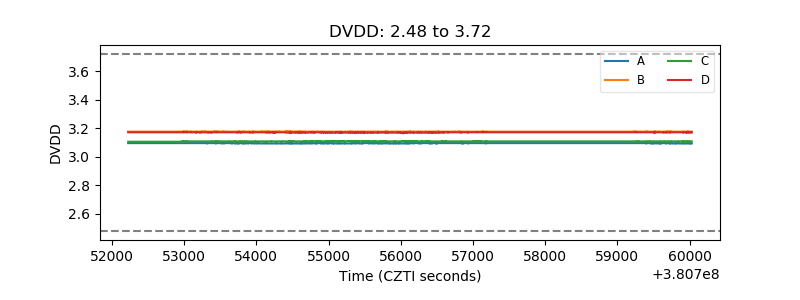 |
| Temperature 1 | 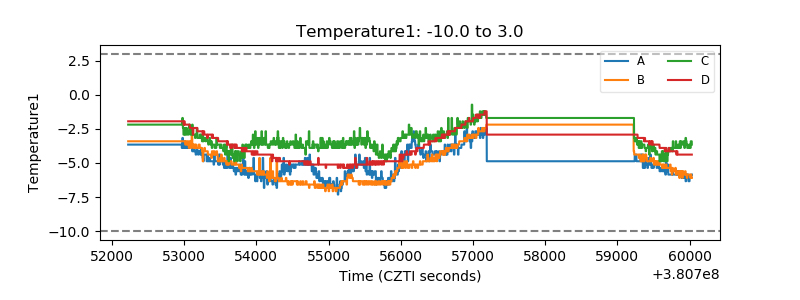 |
| Veto HV Monitor | 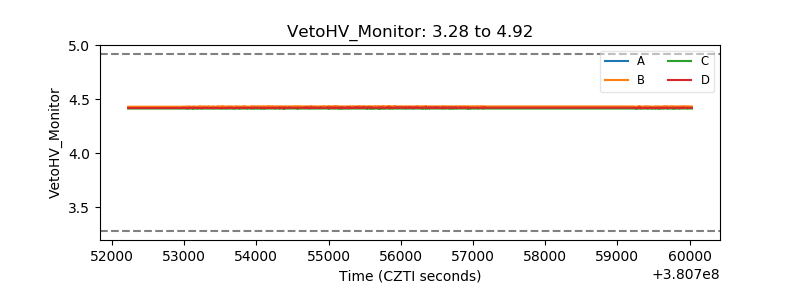 |
| Veto LLD | 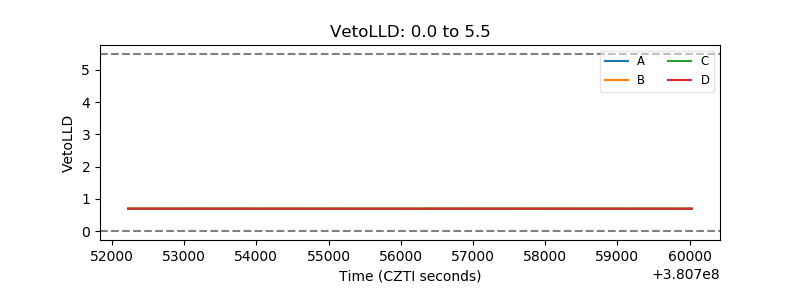 |
| Alpha Counter | 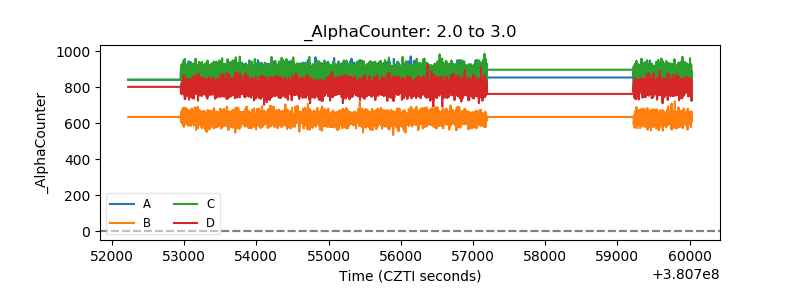 |
| _CPM_Rate | 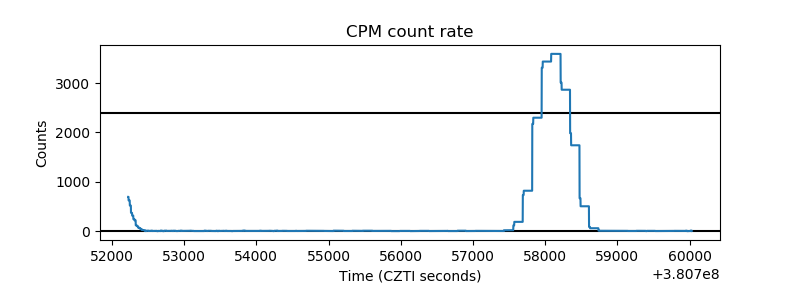 |
| CZT Counter | 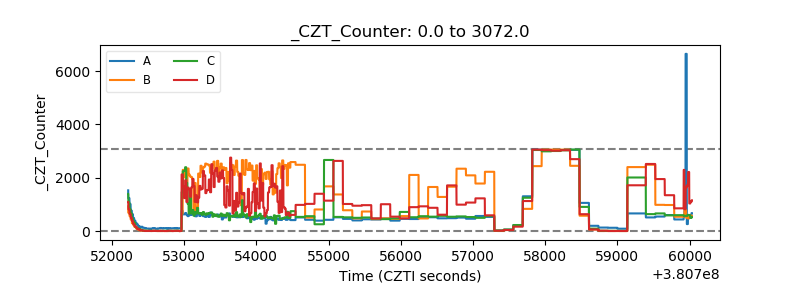 |
| +2.5 Volts monitor | 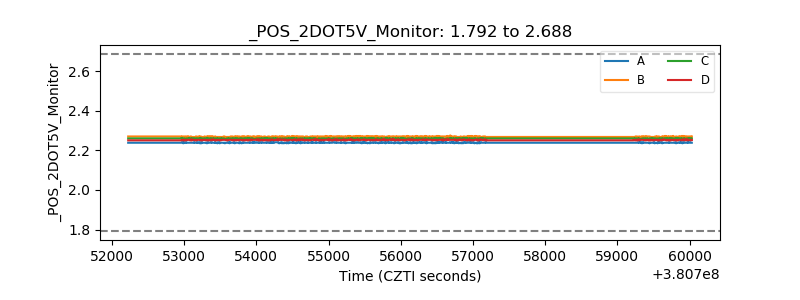 |
| +5 Volts monitor | 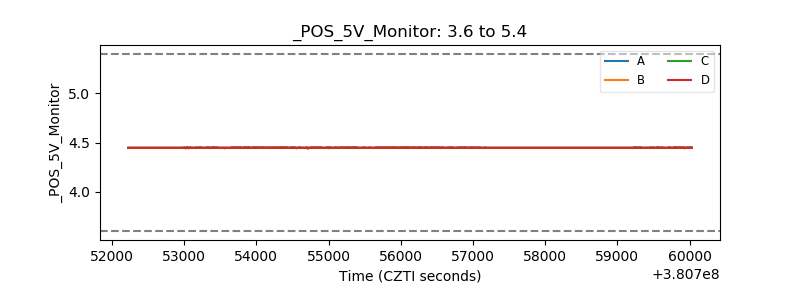 |
| _ROLL_ROT | 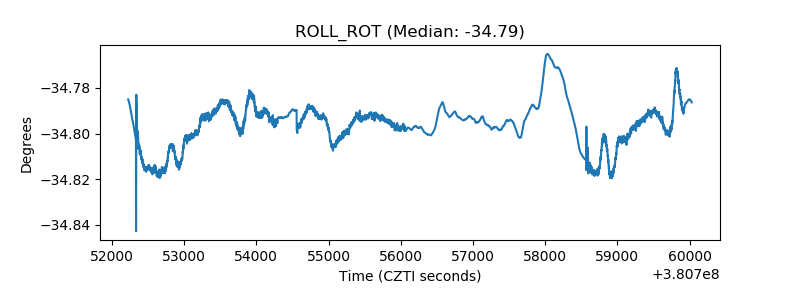 |
| _Roll_DEC | 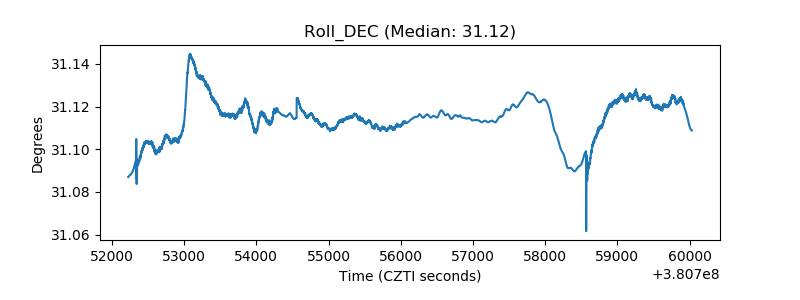 |
| _Roll_RA | 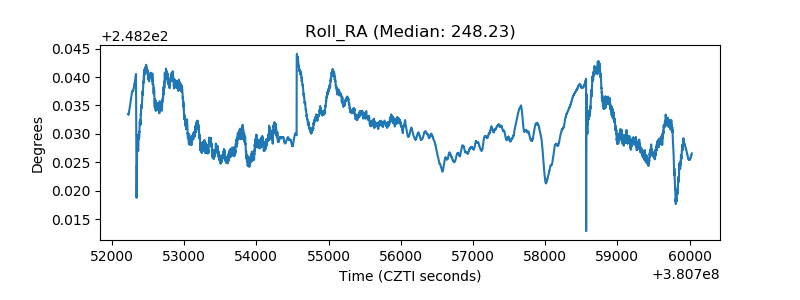 |
| Veto Counter | 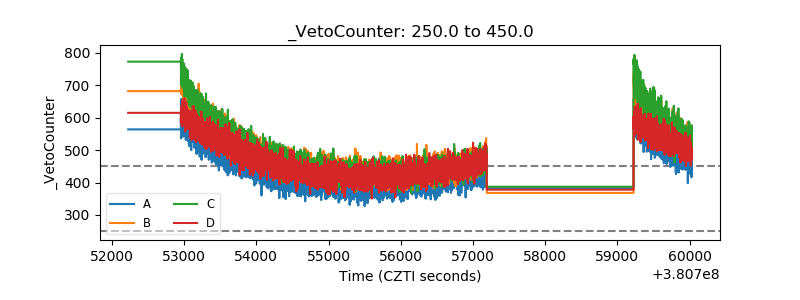 |