| Param | Original file | Final file |
|---|---|---|
| Filename | modeM0/AS1A11_047T15_9000004882_34203cztM0_level2.evt | modeM0/AS1A11_047T15_9000004882_34203cztM0_level2_quad_clean.evt |
| Size (bytes) | 672,563,520 | 68,964,480 |
| Size | 641.4 MB | 65.8 MB |
| Events in quadrant A | 2,662,599 | 450,973 |
| Events in quadrant B | 7,193,398 | 417,030 |
| Events in quadrant C | 3,158,229 | 455,995 |
| Events in quadrant D | 7,000,883 | 396,903 |
| Mode SS | |||
|---|---|---|---|
| Quadrant | BADHDUFLAG | Total packets | Discarded packets |
| A | 0 | 108 | 0 |
| B | 0 | 108 | 0 |
| C | 0 | 108 | 0 |
| D | 0 | 108 | 0 |
| Mode M9 | |||
|---|---|---|---|
| Quadrant | BADHDUFLAG | Total packets | Discarded packets |
| A | 0 | 28 | 0 |
| B | 0 | 28 | 0 |
| C | 0 | 28 | 0 |
| D | 0 | 29 | 0 |
| Mode M0 | |||
|---|---|---|---|
| Quadrant | BADHDUFLAG | Total packets | Discarded packets |
| A | 0 | 11180 | 3 |
| B | 0 | 24913 | 2 |
| C | 0 | 12561 | 2 |
| D | 0 | 24483 | 2 |
| Quadrant | Total seconds | Saturated seconds | Saturation percentage |
|---|---|---|---|
| A | 5233 | 9 | 0.171985% |
| B | 5233 | 1768 | 33.785591% |
| C | 5233 | 151 | 2.885534% |
| D | 5233 | 929 | 17.752723% |
Noise dominated data is calculated using 1-second bins in cleaned event files. If a bin has >2000 counts, and if more than 50% of those come from <1% of pixels, then it is considered to be noise-dominated and hence unusable.
| Quadrant | # 1 sec bins | Bins with >0 counts | Bins with >2000 counts | High rate bins dominated by noise | Noise dominated (total time) | Noise dominated (detector-on time) | Marked lightcurve |
|---|---|---|---|---|---|---|---|
| A | 7145 | 5234 | 5 | 5 | 0.07% | 0.10% | 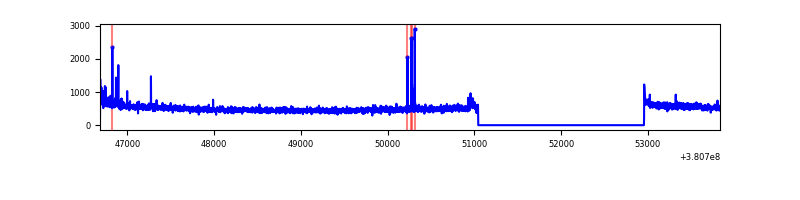 |
| B | 7145 | 5234 | 1523 | 1523 | 21.32% | 29.10% | 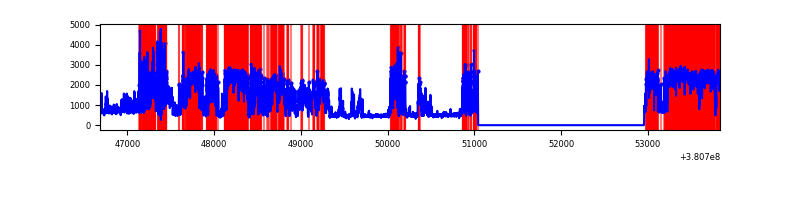 |
| C | 7145 | 5234 | 86 | 86 | 1.20% | 1.64% | 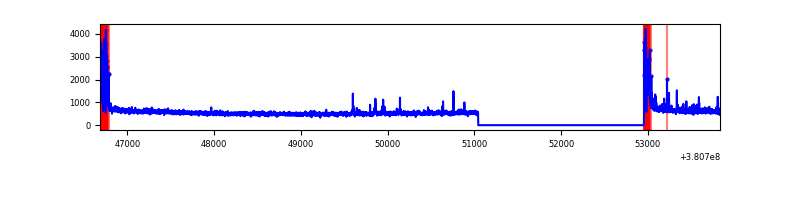 |
| D | 7145 | 5234 | 820 | 820 | 11.48% | 15.67% | 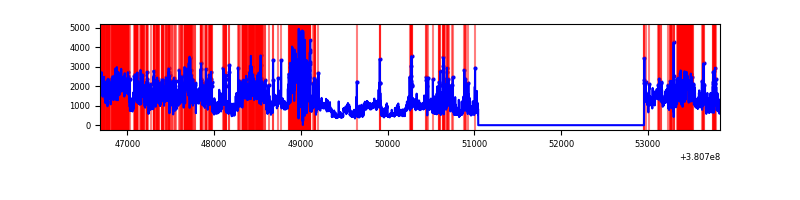 |
Top three noisy pixels from each quadrant. If the there are fewer than three noisy pixels in the level2.evt file, extra rows are filled as -1
| Pixel properties | Quadrant properties | ||||||
|---|---|---|---|---|---|---|---|
| Quadrant | DetID | PixID | Counts | Sigma | Mean | Median | Sigma |
| A | 9 | 143 | 35841 | 266.48 | 663 | 652 | 132.1 |
| A | 10 | 83 | 23654 | 174.19 | 663 | 652 | 132.1 |
| A | 13 | 6 | 21564 | 158.36 | 663 | 652 | 132.1 |
| B | 5 | 31 | 1782674 | 16319.59 | 580 | 567 | 109.2 |
| B | 5 | 15 | 1438217 | 13165.24 | 580 | 567 | 109.2 |
| B | 5 | 14 | 632856 | 5790.17 | 580 | 567 | 109.2 |
| C | 0 | 10 | 349174 | 2347.65 | 641 | 647 | 148.5 |
| C | 15 | 214 | 236582 | 1589.24 | 641 | 647 | 148.5 |
| C | 0 | 207 | 21059 | 137.49 | 641 | 647 | 148.5 |
| D | 8 | 195 | 1719341 | 10416.01 | 605 | 595 | 165.0 |
| D | 12 | 217 | 1445267 | 8755.05 | 605 | 595 | 165.0 |
| D | 10 | 118 | 528815 | 3201.14 | 605 | 595 | 165.0 |
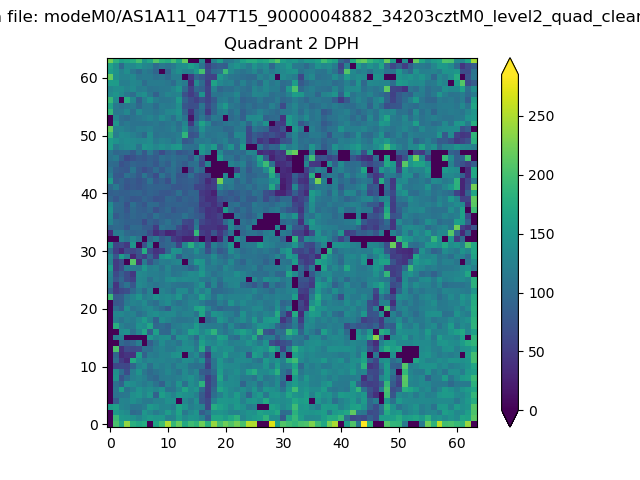
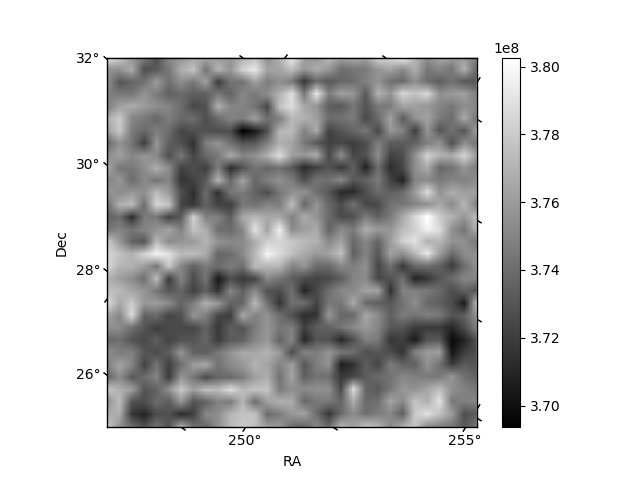
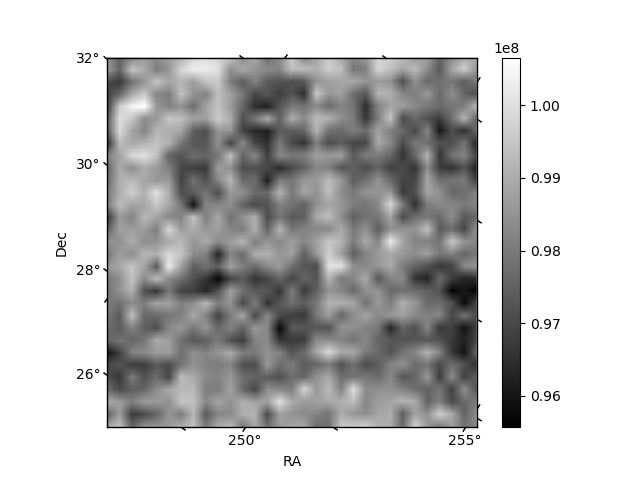
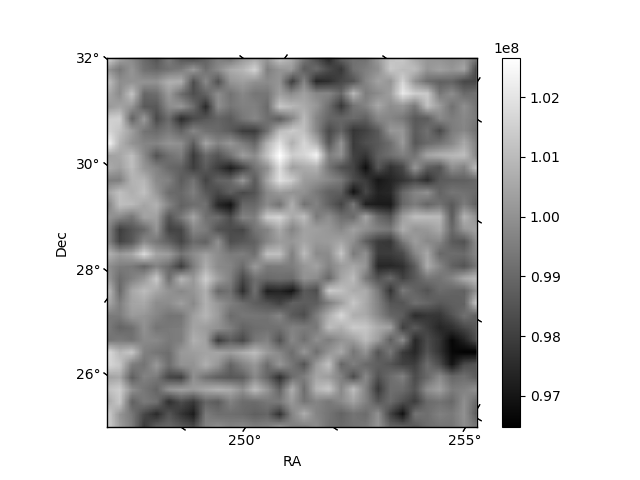
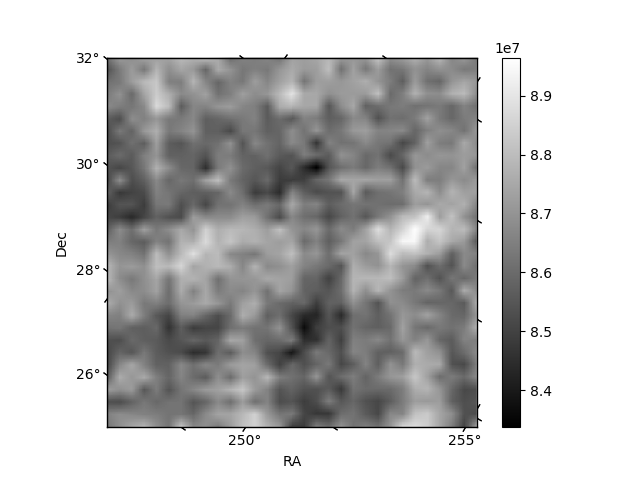
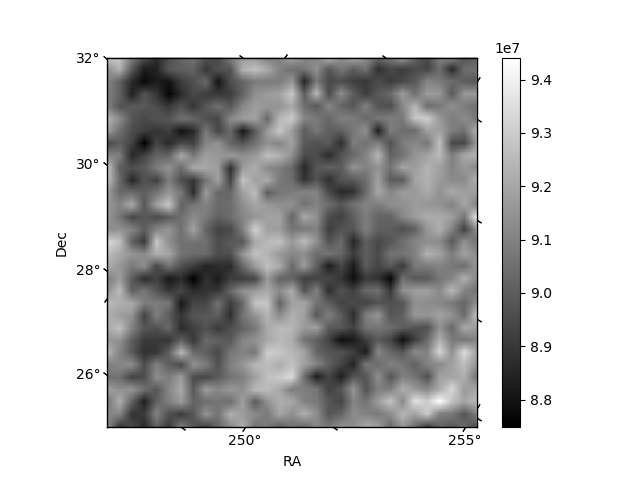
Histogram calculated using DETX and DETY for each event in the final _common_clean file
| Quadrant A | 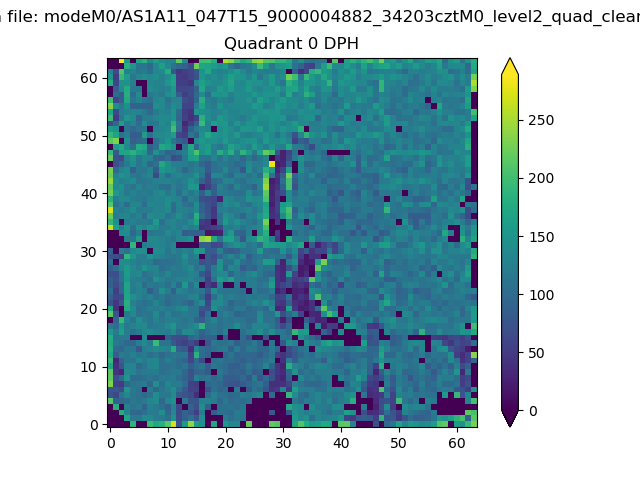 |
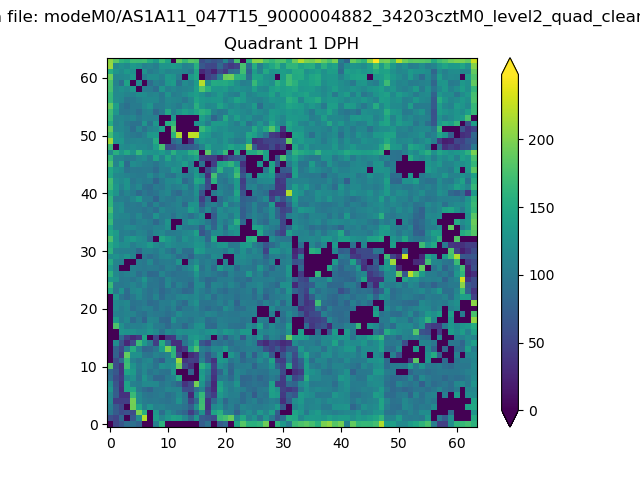 |
Quadrant B |
|---|---|---|---|
| Quadrant D | 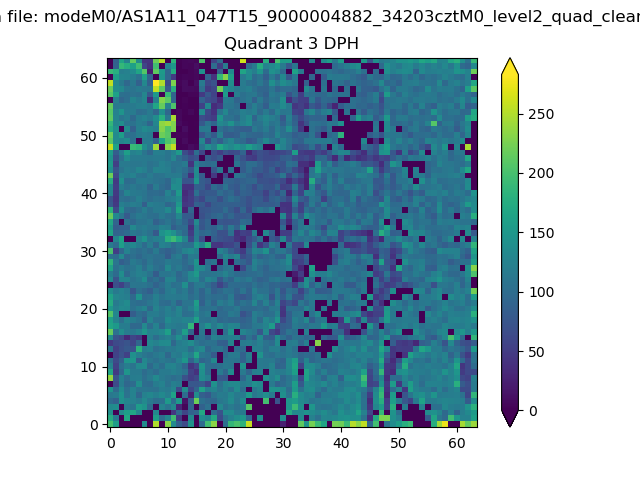 |
 |
Quadrant C |
| Plot type | Count rate plots | Images |
|---|---|---|
| Comparison with Poisson distribution Blue bars denote a histogram of data divided into 1 sec bins. Red curve is a Poisson curve with rate = median count rate of data. |
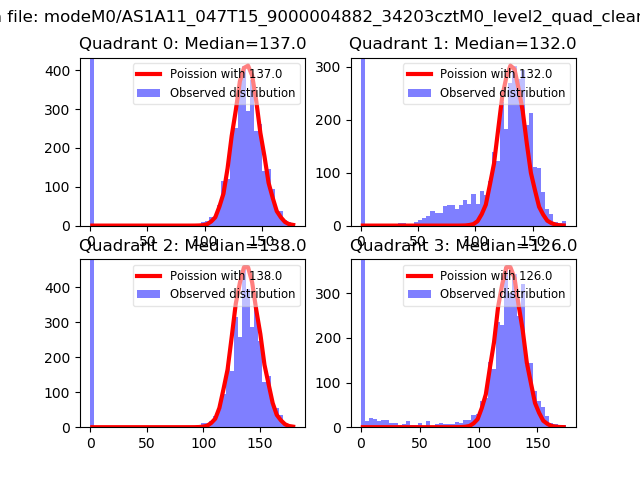 |
 |
| Quadrant-wise count rates Data is divided into 100 sec bins |
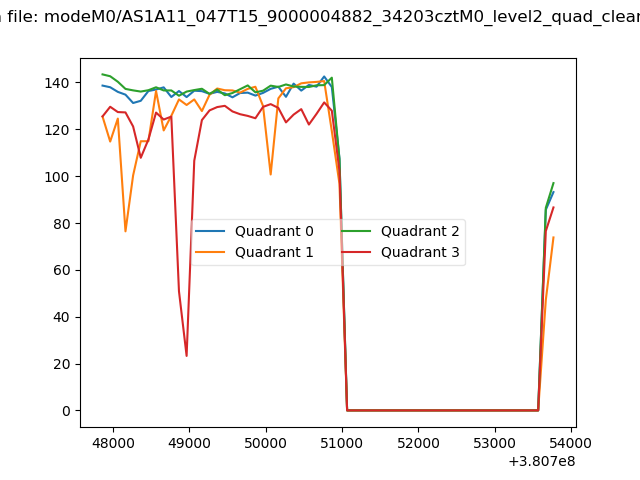 |
|
| Module-wise count rates for Quadrant A Data is divided into 100 sec bins |
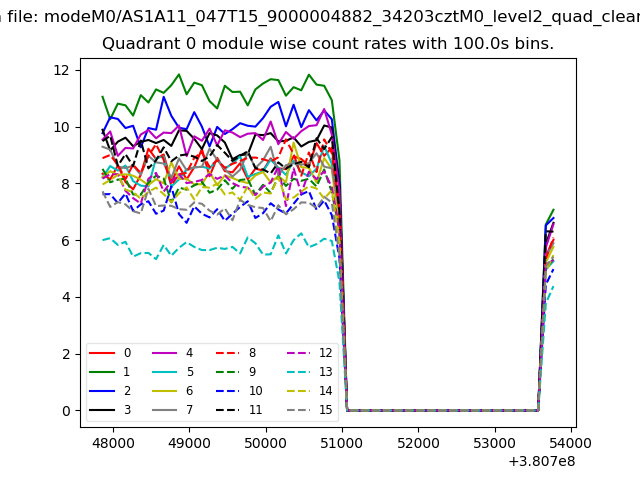 |
 |
| Module-wise count rates for Quadrant B Data is divided into 100 sec bins |
 |
 |
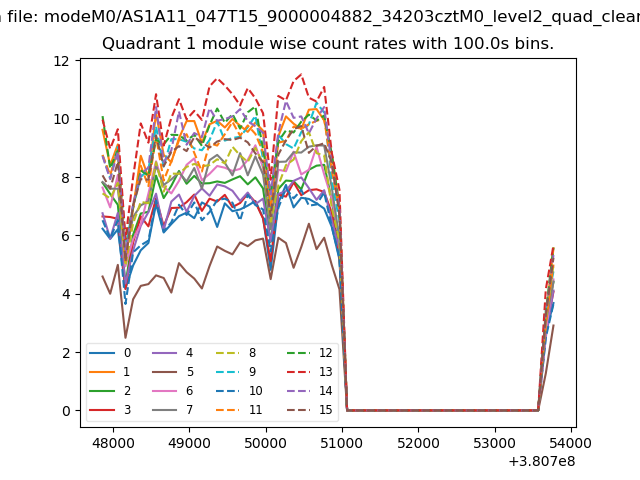
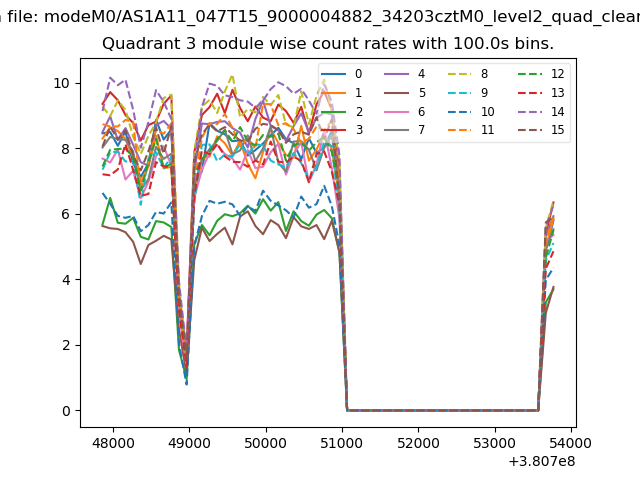
| Module-wise count rates for Quadrant C Data is divided into 100 sec bins |
 |
 |
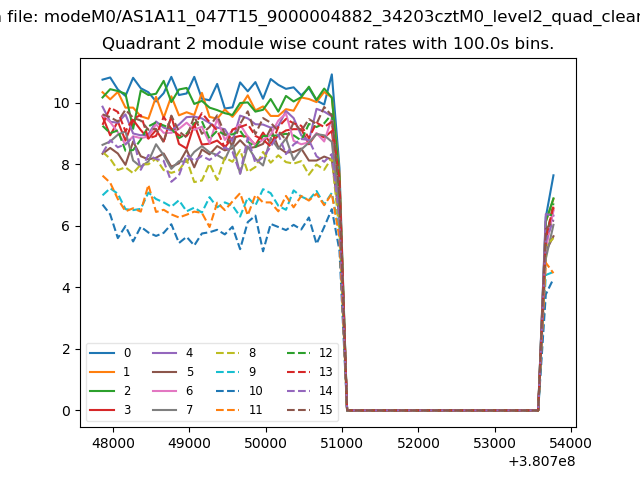
| Module-wise count rates for Quadrant D Data is divided into 100 sec bins |
 |
 |
| Parameter | Plot |
|---|---|
| CZT HV Monitor | 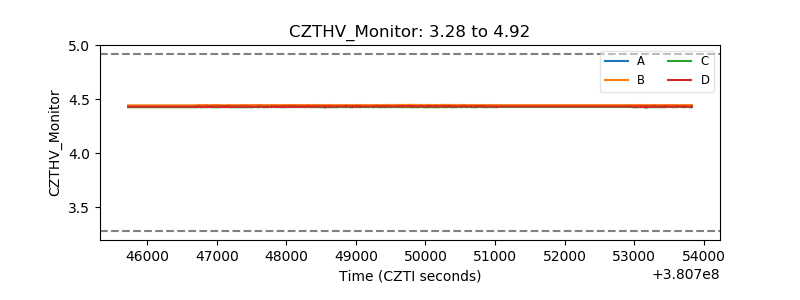 |
| D_VDD | 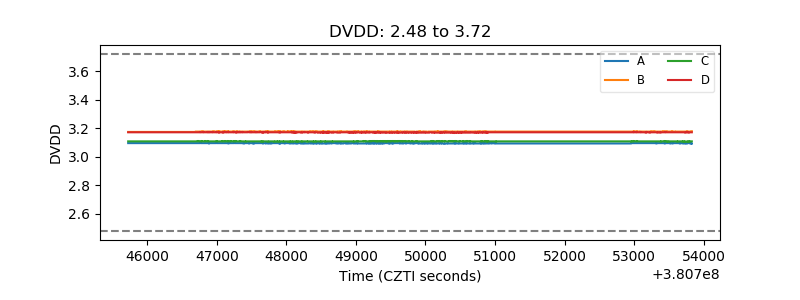 |
| Temperature 1 | 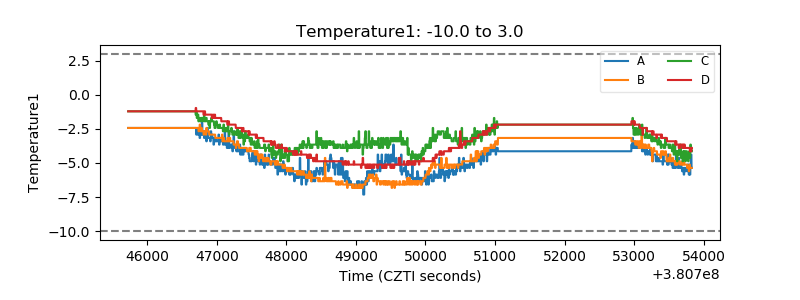 |
| Veto HV Monitor | 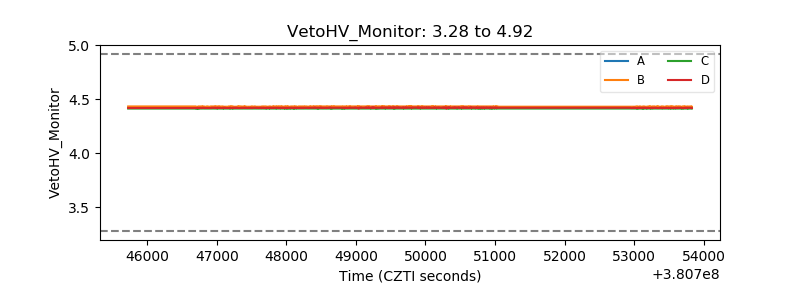 |
| Veto LLD | 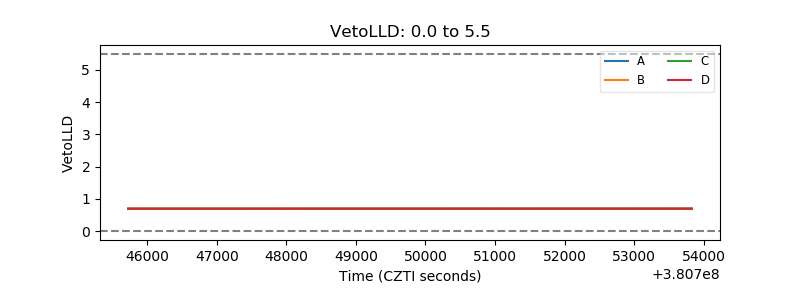 |
| Alpha Counter | 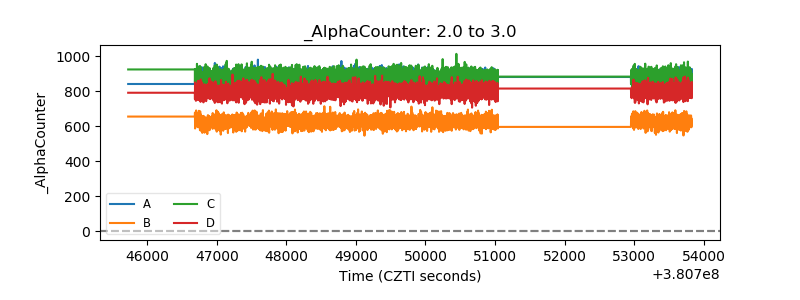 |
| _CPM_Rate | 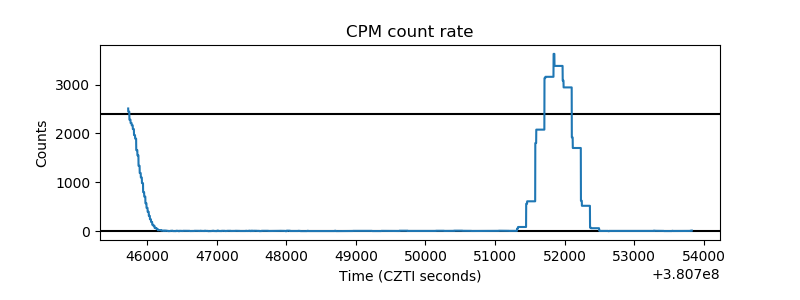 |
| CZT Counter | 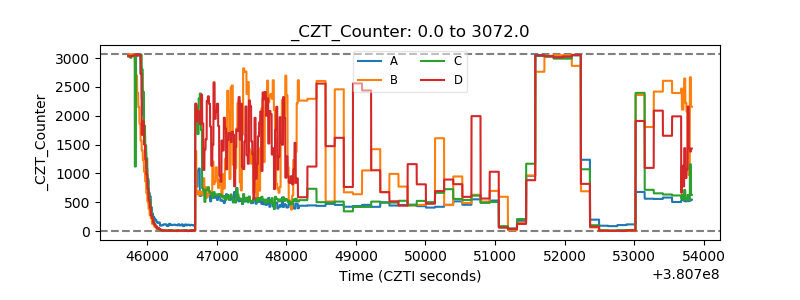 |
| +2.5 Volts monitor | 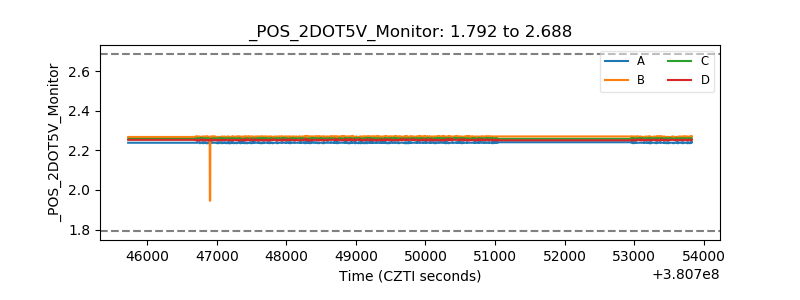 |
| +5 Volts monitor | 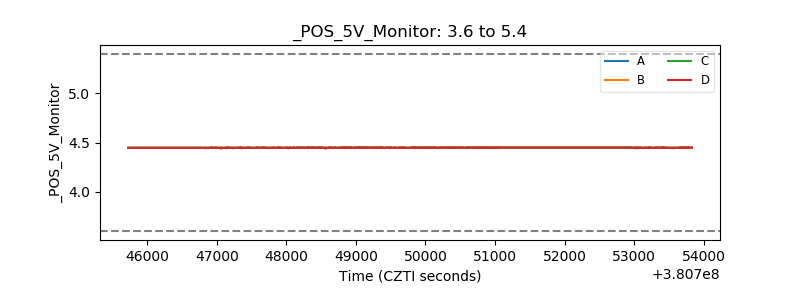 |
| _ROLL_ROT | 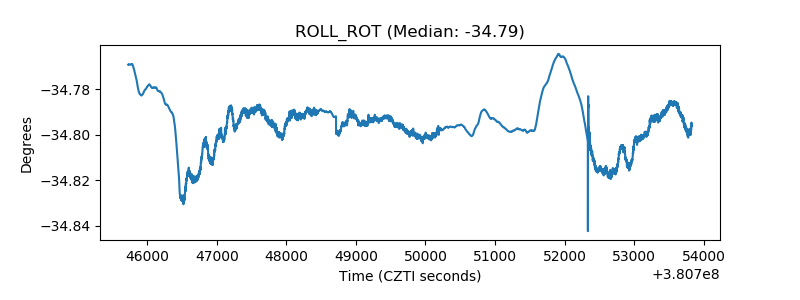 |
| _Roll_DEC | 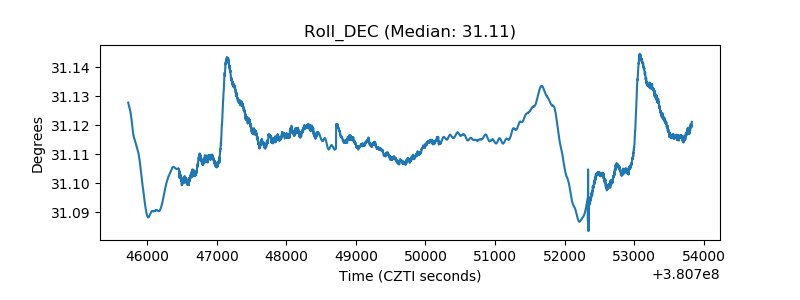 |
| _Roll_RA | 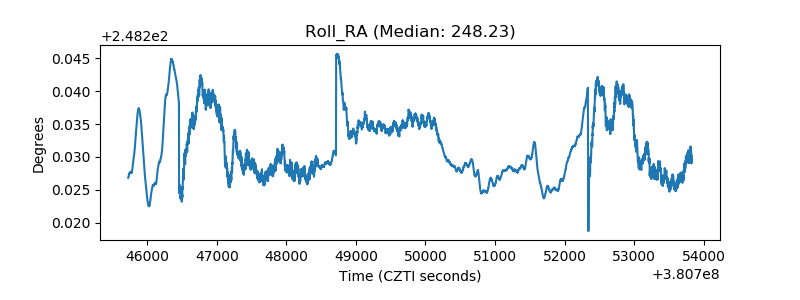 |
| Veto Counter | 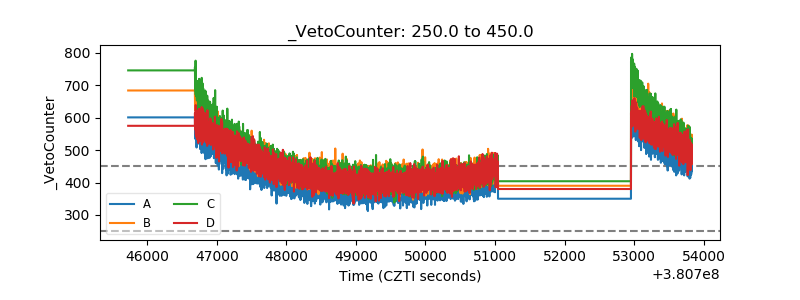 |