| Param | Original file | Final file |
|---|---|---|
| Filename | modeM0/AS1A11_047T15_9000004882_34194cztM0_level2.evt | modeM0/AS1A11_047T15_9000004882_34194cztM0_level2_quad_clean.evt |
| Size (bytes) | 497,928,960 | 65,600,640 |
| Size | 474.9 MB | 62.6 MB |
| Events in quadrant A | 2,508,448 | 413,222 |
| Events in quadrant B | 4,236,783 | 401,443 |
| Events in quadrant C | 3,787,624 | 404,156 |
| Events in quadrant D | 4,174,243 | 382,629 |
| Mode SS | |||
|---|---|---|---|
| Quadrant | BADHDUFLAG | Total packets | Discarded packets |
| A | 0 | 112 | 0 |
| B | 0 | 112 | 0 |
| C | 0 | 112 | 0 |
| D | 0 | 112 | 0 |
| Mode M9 | |||
|---|---|---|---|
| Quadrant | BADHDUFLAG | Total packets | Discarded packets |
| A | 0 | 16 | 0 |
| B | 0 | 16 | 0 |
| C | 0 | 16 | 0 |
| D | 0 | 16 | 0 |
| Mode M0 | |||
|---|---|---|---|
| Quadrant | BADHDUFLAG | Total packets | Discarded packets |
| A | 0 | 11058 | 2 |
| B | 0 | 16308 | 1 |
| C | 0 | 14882 | 1 |
| D | 0 | 16370 | 1 |
| Quadrant | Total seconds | Saturated seconds | Saturation percentage |
|---|---|---|---|
| A | 5498 | 2 | 0.036377% |
| B | 5498 | 498 | 9.057839% |
| C | 5498 | 156 | 2.837395% |
| D | 5498 | 103 | 1.873409% |
Noise dominated data is calculated using 1-second bins in cleaned event files. If a bin has >2000 counts, and if more than 50% of those come from <1% of pixels, then it is considered to be noise-dominated and hence unusable.
| Quadrant | # 1 sec bins | Bins with >0 counts | Bins with >2000 counts | High rate bins dominated by noise | Noise dominated (total time) | Noise dominated (detector-on time) | Marked lightcurve |
|---|---|---|---|---|---|---|---|
| A | 7141 | 5499 | 0 | 0 | 0.00% | 0.00% | 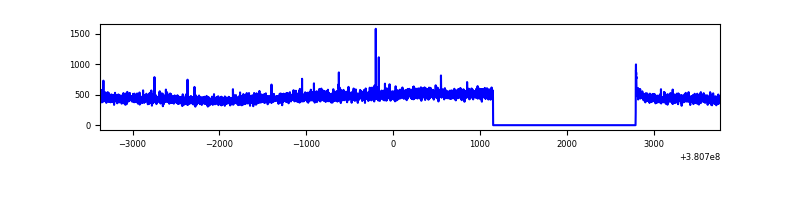 |
| B | 7141 | 5499 | 285 | 285 | 3.99% | 5.18% | 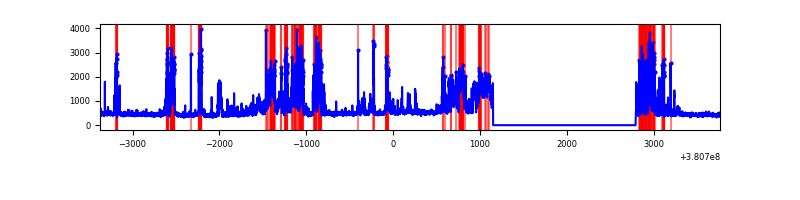 |
| C | 7141 | 5499 | 123 | 123 | 1.72% | 2.24% | 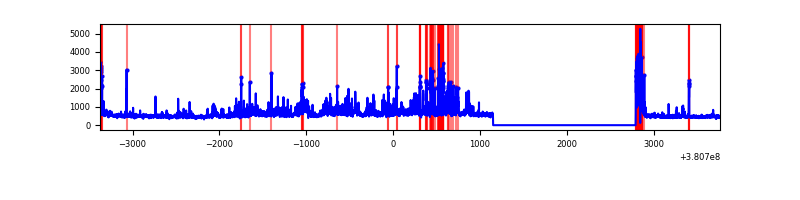 |
| D | 7141 | 5499 | 67 | 67 | 0.94% | 1.22% | 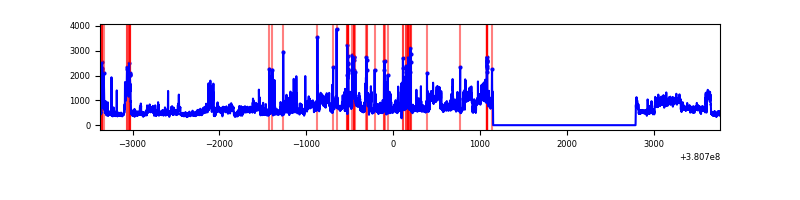 |
Top three noisy pixels from each quadrant. If the there are fewer than three noisy pixels in the level2.evt file, extra rows are filled as -1
| Pixel properties | Quadrant properties | ||||||
|---|---|---|---|---|---|---|---|
| Quadrant | DetID | PixID | Counts | Sigma | Mean | Median | Sigma |
| A | 10 | 83 | 15123 | 112.15 | 640 | 626 | 129.3 |
| A | 13 | 6 | 12069 | 88.52 | 640 | 626 | 129.3 |
| A | 13 | 254 | 10149 | 73.67 | 640 | 626 | 129.3 |
| B | 5 | 172 | 918196 | 7710.45 | 618 | 603 | 119.0 |
| B | 5 | 31 | 482847 | 4052.25 | 618 | 603 | 119.0 |
| B | 5 | 15 | 232222 | 1946.27 | 618 | 603 | 119.0 |
| C | 0 | 239 | 859107 | 6030.16 | 611 | 614 | 142.4 |
| C | 15 | 214 | 250108 | 1752.48 | 611 | 614 | 142.4 |
| C | 0 | 10 | 221246 | 1549.75 | 611 | 614 | 142.4 |
| D | 8 | 195 | 929966 | 6153.91 | 614 | 597 | 151.0 |
| D | 10 | 118 | 268960 | 1776.99 | 614 | 597 | 151.0 |
| D | 13 | 249 | 149292 | 984.6 | 614 | 597 | 151.0 |
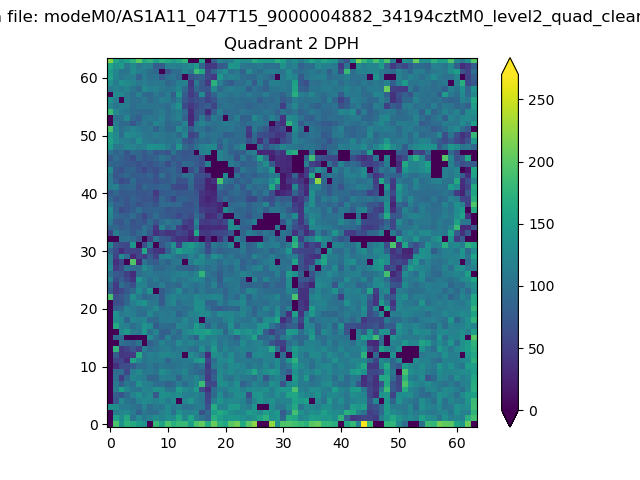
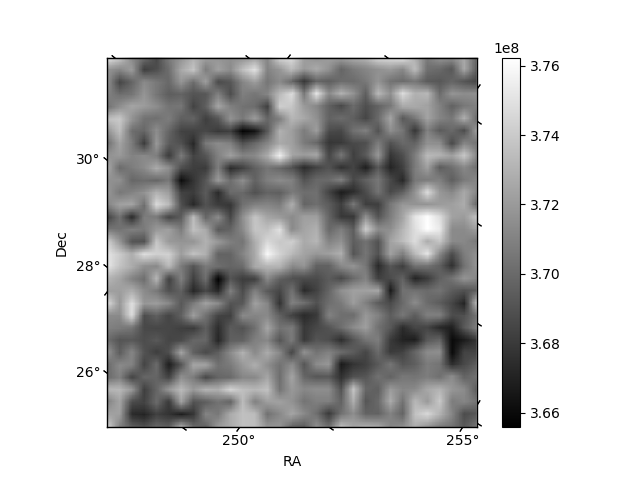
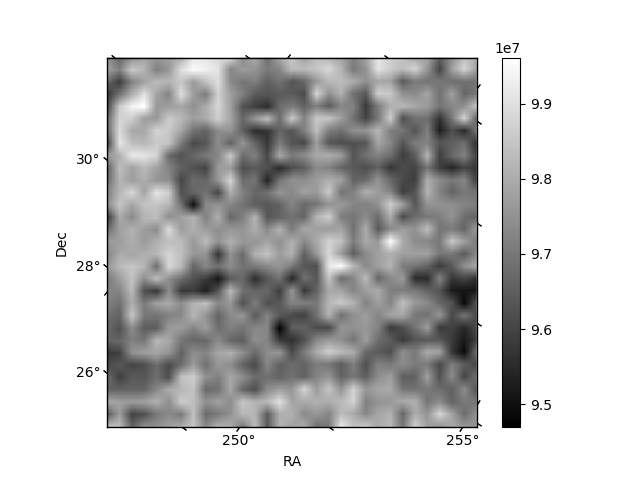
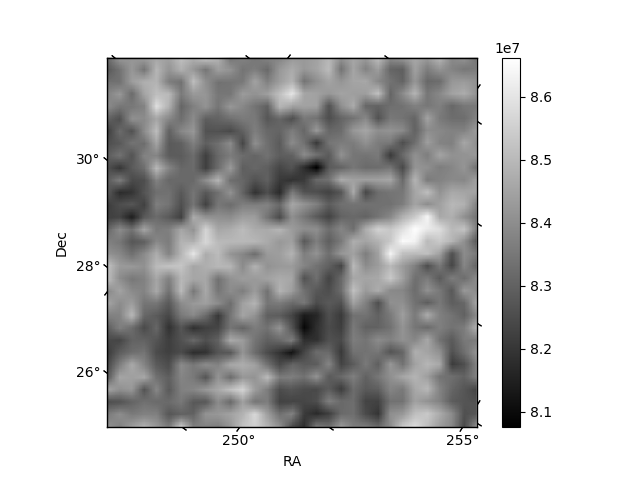
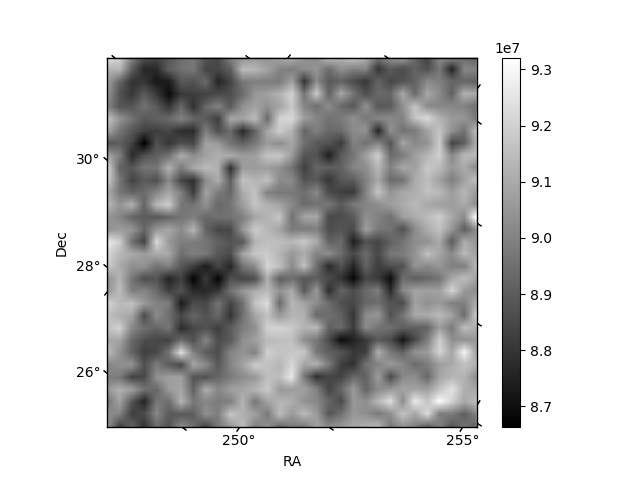
Histogram calculated using DETX and DETY for each event in the final _common_clean file
| Quadrant A | 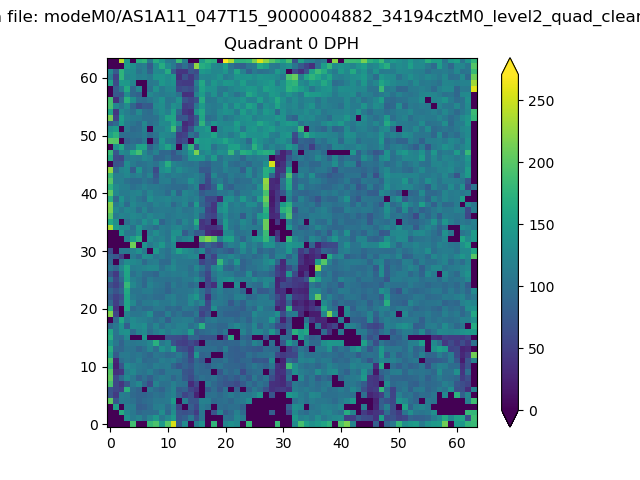 |
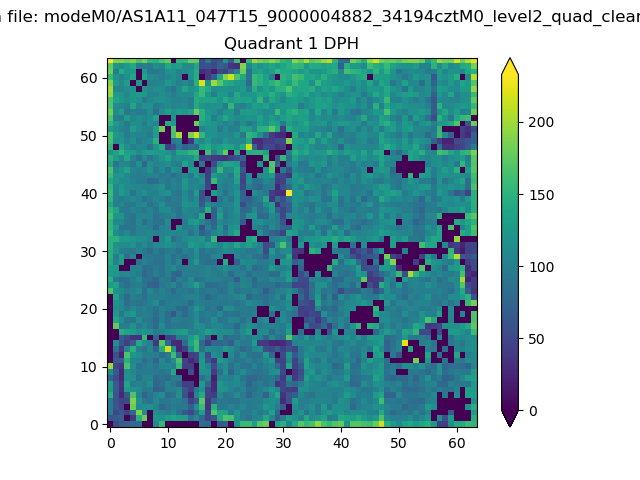 |
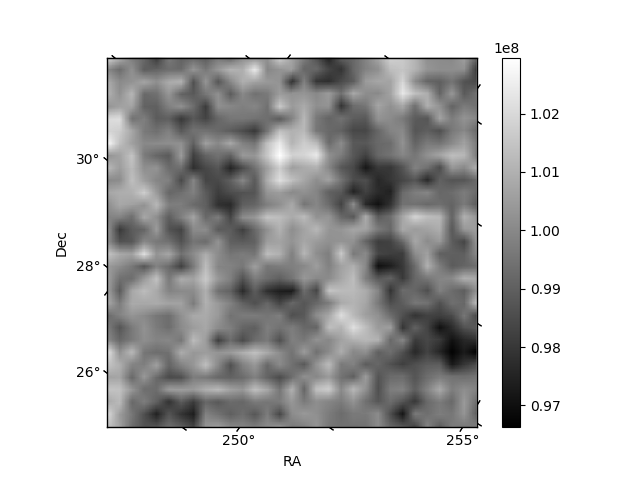
Quadrant B |
|---|---|---|---|
| Quadrant D | 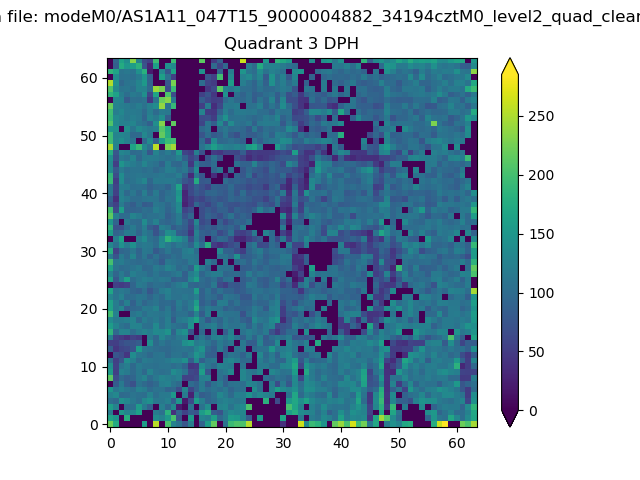 |
 |
Quadrant C |
| Plot type | Count rate plots | Images |
|---|---|---|
| Comparison with Poisson distribution Blue bars denote a histogram of data divided into 1 sec bins. Red curve is a Poisson curve with rate = median count rate of data. |
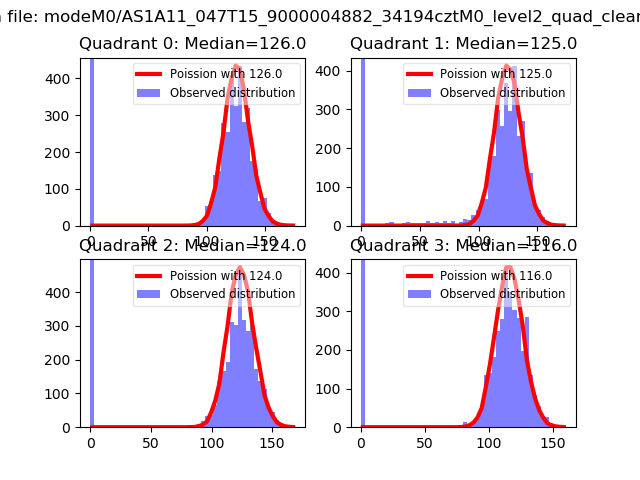 |
 |
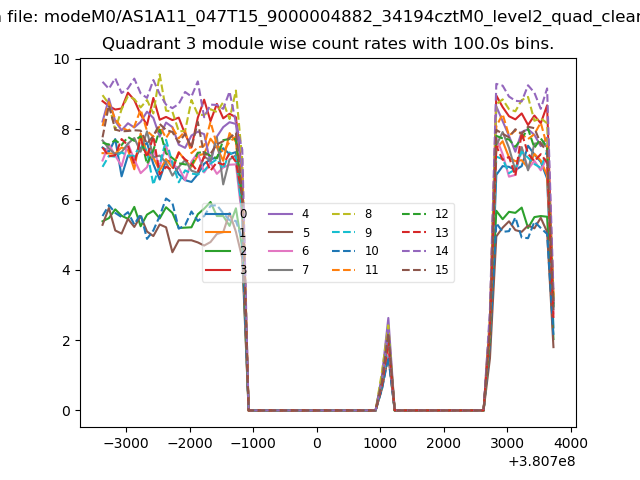
| Quadrant-wise count rates Data is divided into 100 sec bins |
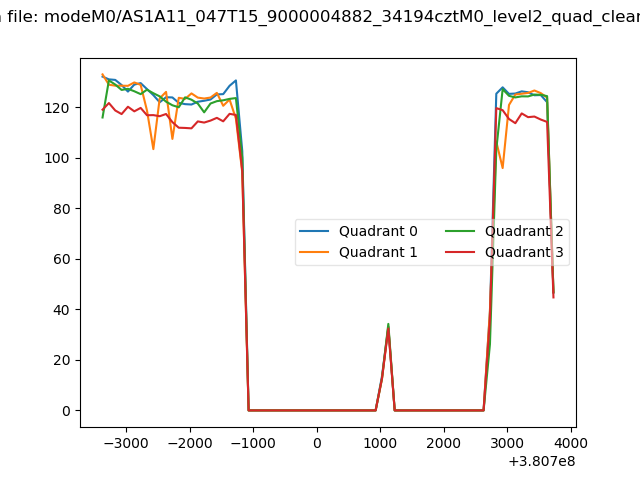 |
|
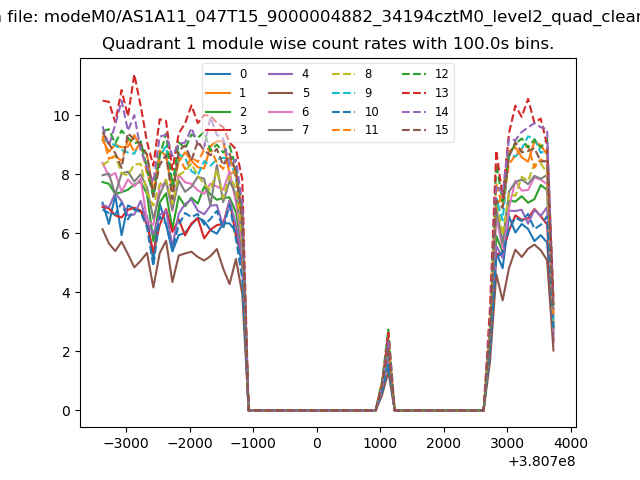
| Module-wise count rates for Quadrant A Data is divided into 100 sec bins |
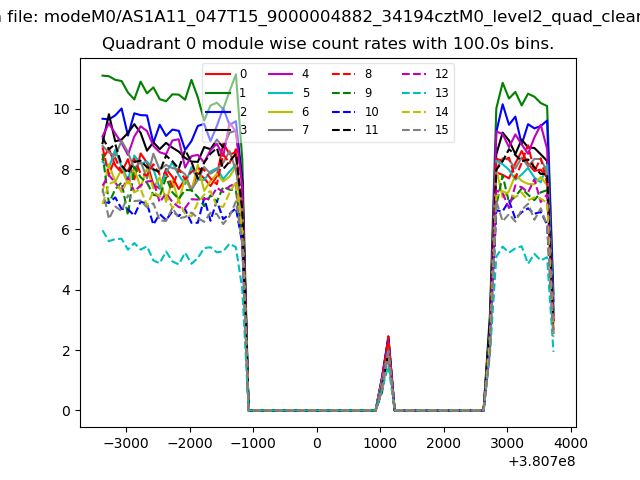 |
 |
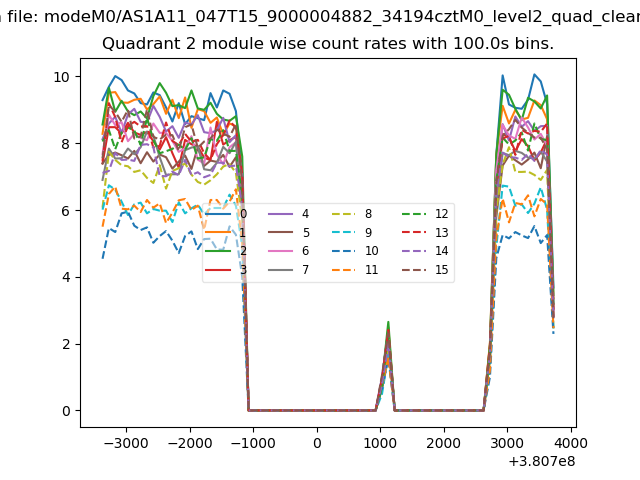
| Module-wise count rates for Quadrant B Data is divided into 100 sec bins |
 |
 |
| Module-wise count rates for Quadrant C Data is divided into 100 sec bins |
 |
 |
| Module-wise count rates for Quadrant D Data is divided into 100 sec bins |
 |
 |
| Parameter | Plot |
|---|---|
| CZT HV Monitor | 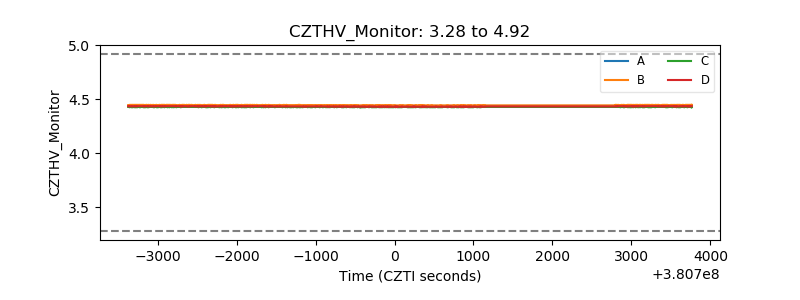 |
| D_VDD | 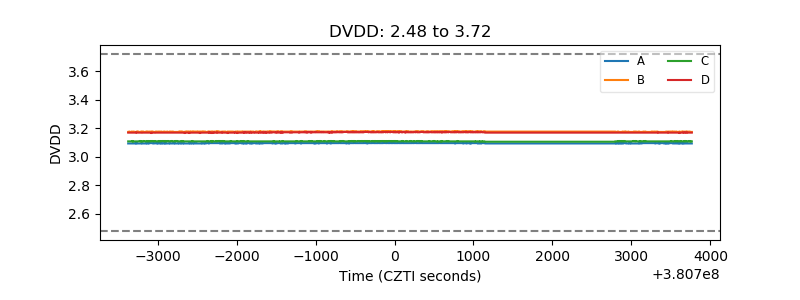 |
| Temperature 1 | 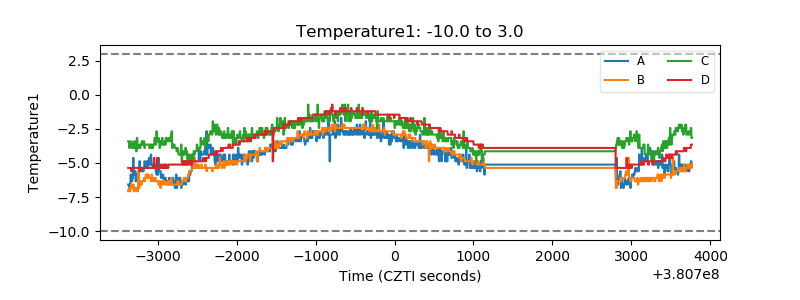 |
| Veto HV Monitor | 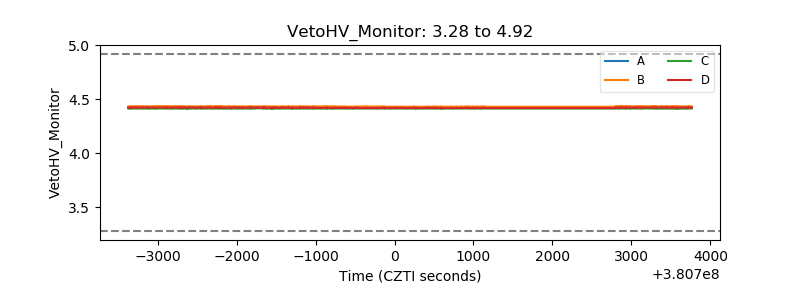 |
| Veto LLD | 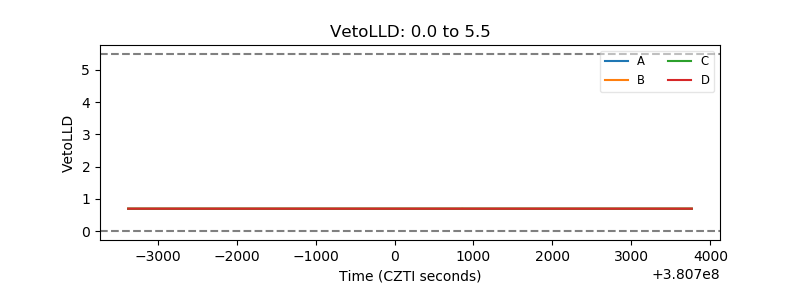 |
| Alpha Counter | 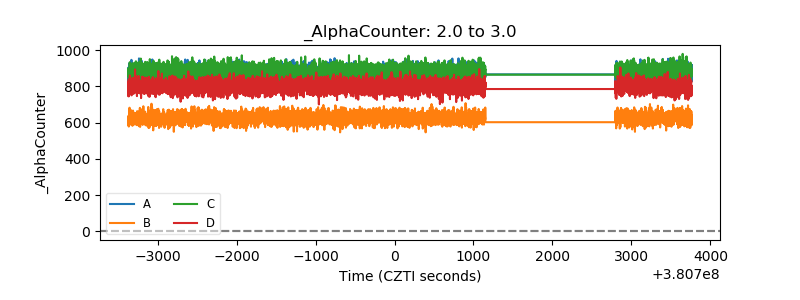 |
| _CPM_Rate | 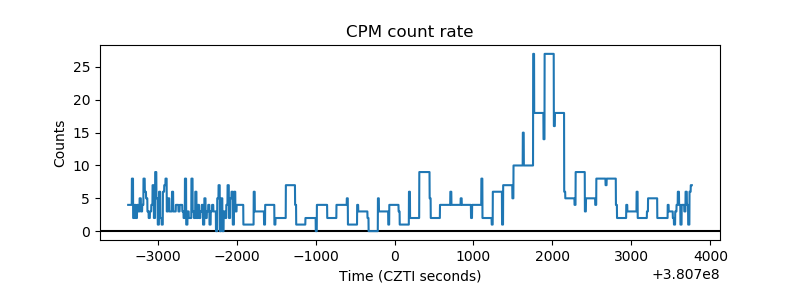 |
| CZT Counter | 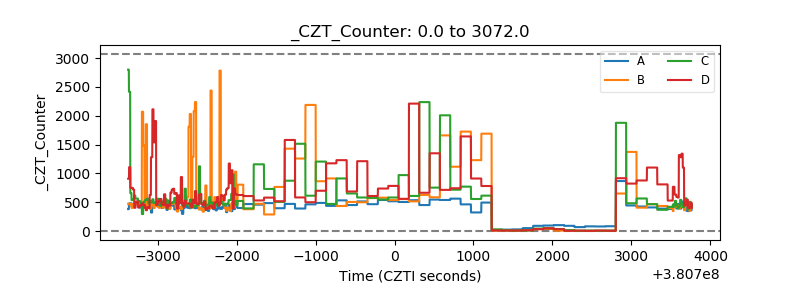 |
| +2.5 Volts monitor | 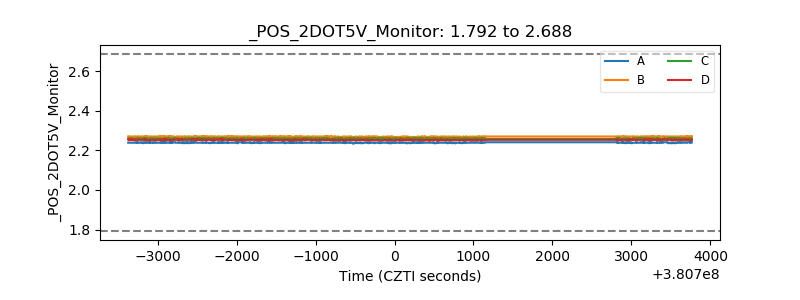 |
| +5 Volts monitor | 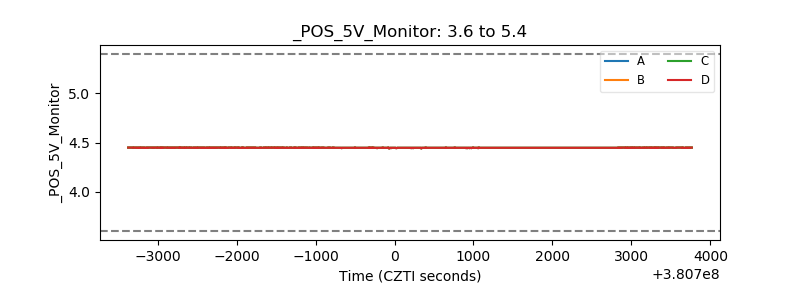 |
| _ROLL_ROT |  |
| _Roll_DEC | 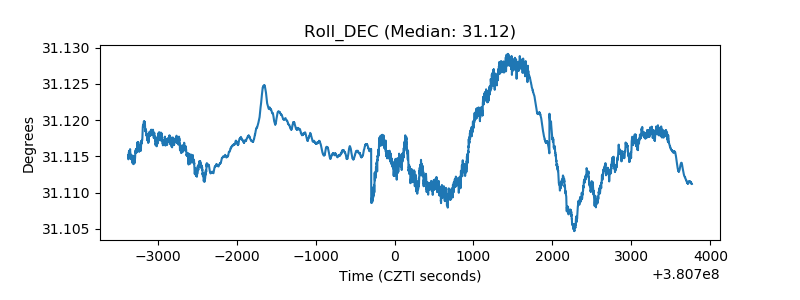 |
| _Roll_RA | 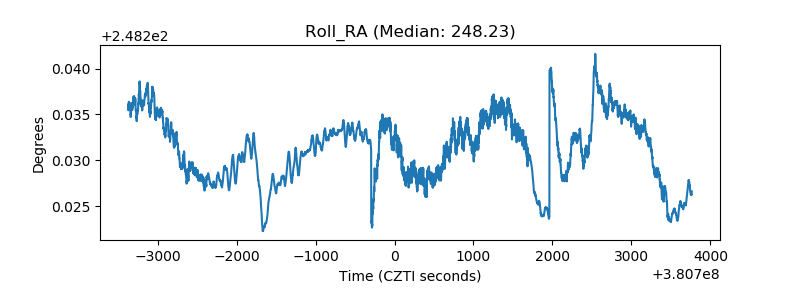 |
| Veto Counter | 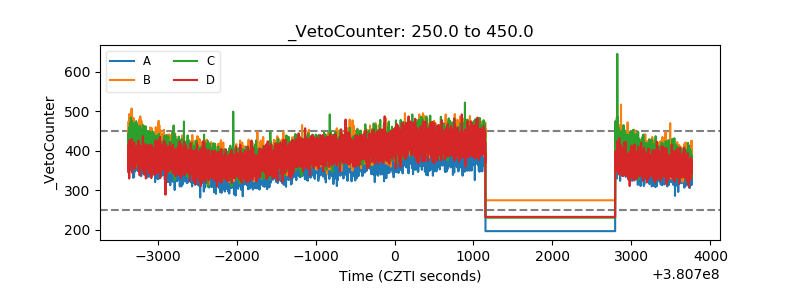 |