| Param | Original file | Final file |
|---|---|---|
| Filename | modeM0/AS1A11_047T15_9000004882_34191cztM0_level2.evt | modeM0/AS1A11_047T15_9000004882_34191cztM0_level2_quad_clean.evt |
| Size (bytes) | 883,350,720 | 171,777,600 |
| Size | 842.4 MB | 163.8 MB |
| Events in quadrant A | 4,649,537 | 1,168,921 |
| Events in quadrant B | 7,694,260 | 1,171,851 |
| Events in quadrant C | 6,665,073 | 1,142,124 |
| Events in quadrant D | 7,122,248 | 1,080,906 |
| Mode SS | |||
|---|---|---|---|
| Quadrant | BADHDUFLAG | Total packets | Discarded packets |
| A | 0 | 190 | 0 |
| B | 0 | 190 | 0 |
| C | 0 | 190 | 0 |
| D | 0 | 190 | 0 |
| Mode M9 | |||
|---|---|---|---|
| Quadrant | BADHDUFLAG | Total packets | Discarded packets |
| A | 0 | 41 | 0 |
| B | 0 | 41 | 0 |
| C | 0 | 41 | 0 |
| D | 0 | 42 | 0 |
| Mode M0 | |||
|---|---|---|---|
| Quadrant | BADHDUFLAG | Total packets | Discarded packets |
| A | 0 | 19411 | 4 |
| B | 0 | 29219 | 3 |
| C | 0 | 25418 | 3 |
| D | 0 | 27480 | 3 |
| Quadrant | Total seconds | Saturated seconds | Saturation percentage |
|---|---|---|---|
| A | 9208 | 8 | 0.086881% |
| B | 9208 | 493 | 5.354040% |
| C | 9208 | 581 | 6.309731% |
| D | 9208 | 209 | 2.269765% |
Noise dominated data is calculated using 1-second bins in cleaned event files. If a bin has >2000 counts, and if more than 50% of those come from <1% of pixels, then it is considered to be noise-dominated and hence unusable.
| Quadrant | # 1 sec bins | Bins with >0 counts | Bins with >2000 counts | High rate bins dominated by noise | Noise dominated (total time) | Noise dominated (detector-on time) | Marked lightcurve |
|---|---|---|---|---|---|---|---|
| A | 13392 | 9210 | 3 | 3 | 0.02% | 0.03% | 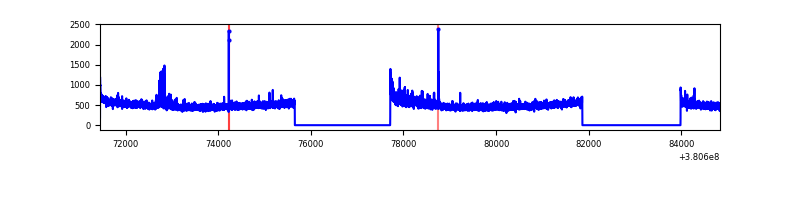 |
| B | 13392 | 9210 | 276 | 276 | 2.06% | 3.00% | 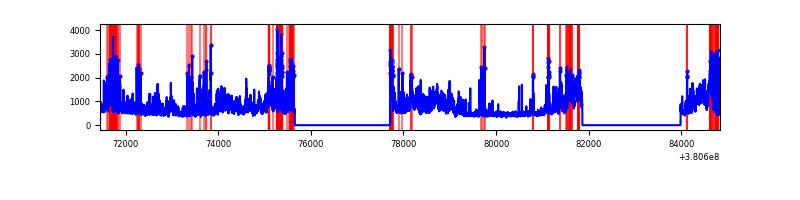 |
| C | 13392 | 9210 | 452 | 452 | 3.38% | 4.91% | 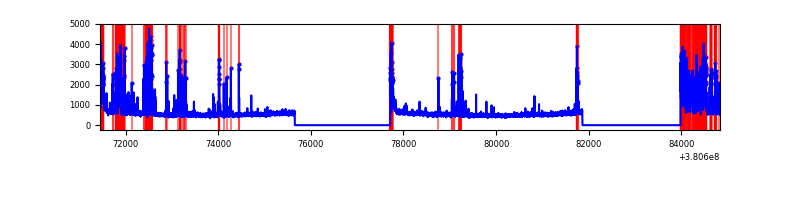 |
| D | 13392 | 9210 | 145 | 145 | 1.08% | 1.57% | 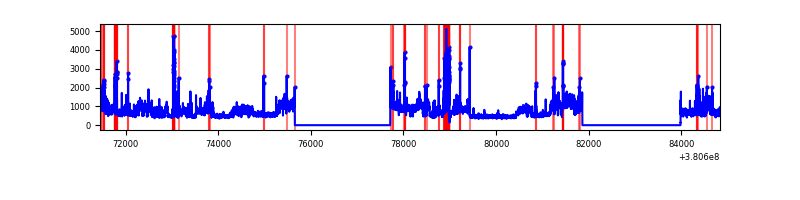 |
Top three noisy pixels from each quadrant. If the there are fewer than three noisy pixels in the level2.evt file, extra rows are filled as -1
| Pixel properties | Quadrant properties | ||||||
|---|---|---|---|---|---|---|---|
| Quadrant | DetID | PixID | Counts | Sigma | Mean | Median | Sigma |
| A | 15 | 169 | 151359 | 657.23 | 1146 | 1128 | 228.6 |
| A | 10 | 83 | 33265 | 140.59 | 1146 | 1128 | 228.6 |
| A | 13 | 6 | 29507 | 124.15 | 1146 | 1128 | 228.6 |
| B | 5 | 31 | 1313213 | 6235.06 | 1132 | 1107 | 210.4 |
| B | 5 | 172 | 1004499 | 4768.06 | 1132 | 1107 | 210.4 |
| B | 5 | 15 | 616960 | 2926.5 | 1132 | 1107 | 210.4 |
| C | 14 | 254 | 772536 | 3106.78 | 1092 | 1105 | 248.3 |
| C | 0 | 239 | 671445 | 2699.65 | 1092 | 1105 | 248.3 |
| C | 0 | 10 | 419284 | 1684.13 | 1092 | 1105 | 248.3 |
| D | 8 | 195 | 1932614 | 7219.85 | 1094 | 1066 | 267.5 |
| D | 13 | 249 | 370408 | 1380.55 | 1094 | 1066 | 267.5 |
| D | 10 | 118 | 131789 | 488.62 | 1094 | 1066 | 267.5 |
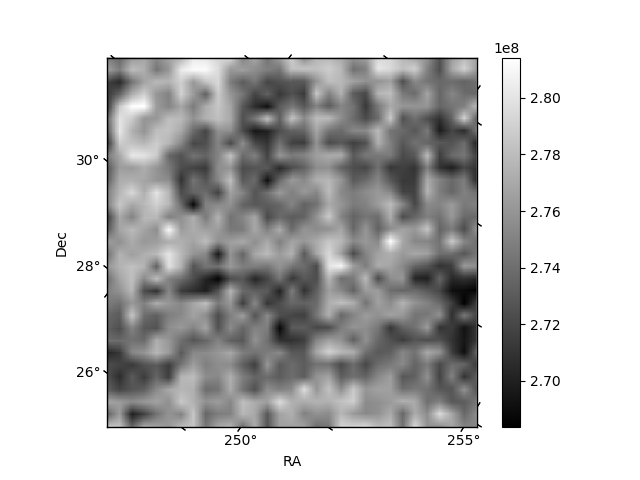
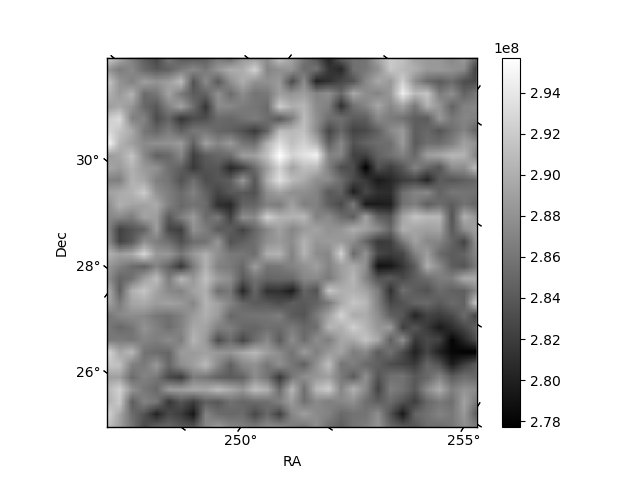
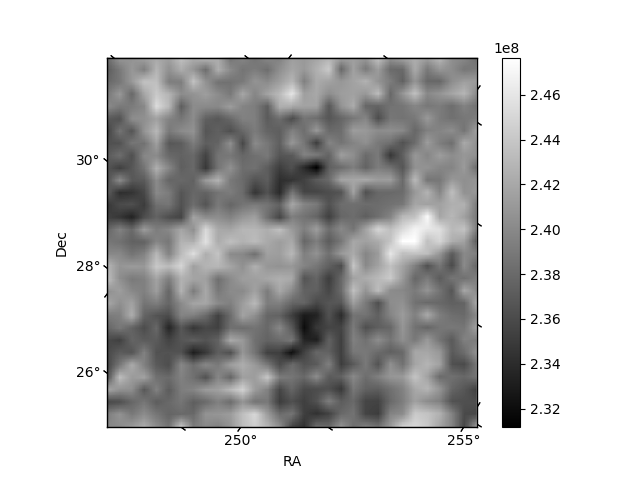
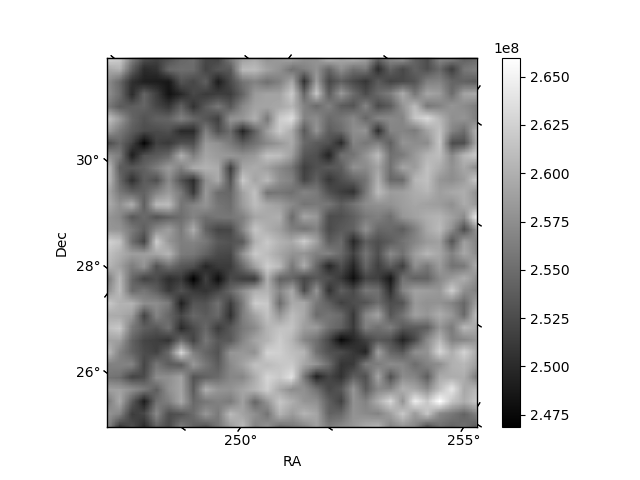
Histogram calculated using DETX and DETY for each event in the final _common_clean file
| Quadrant A | 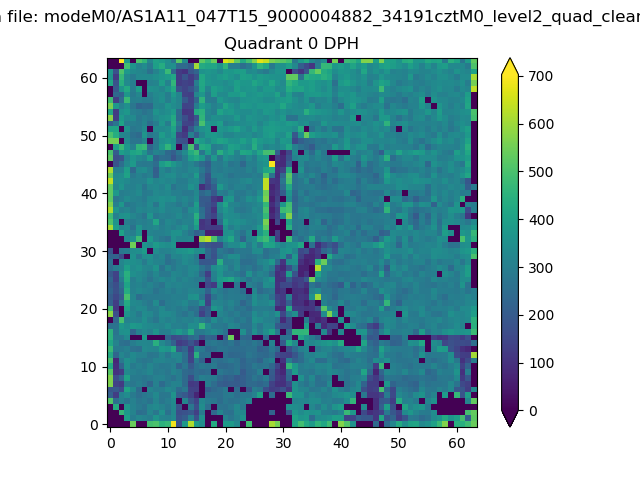 |
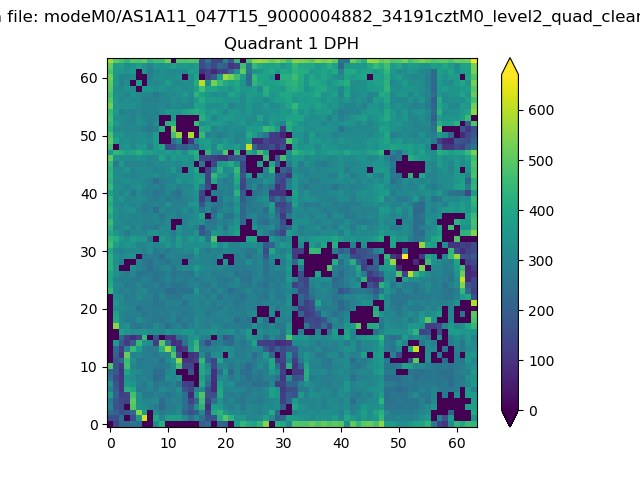 |
Quadrant B |
|---|---|---|---|
| Quadrant D | 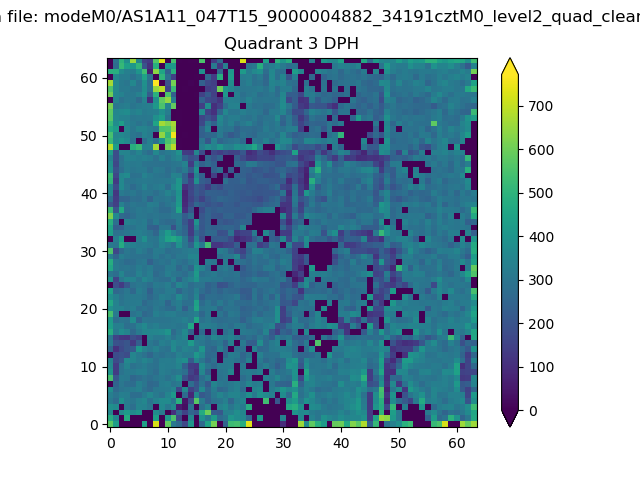 |
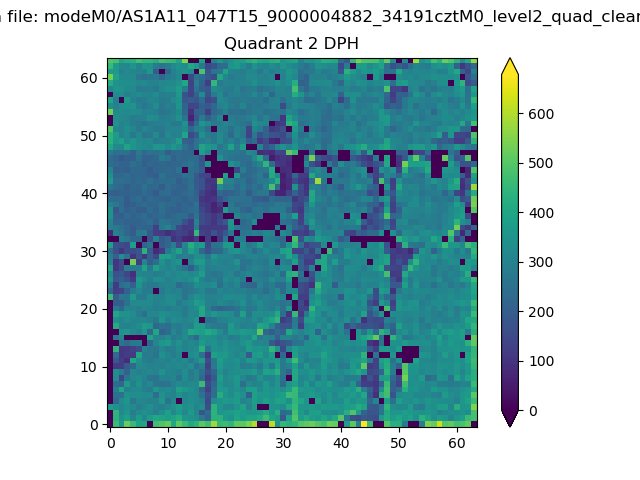 |
Quadrant C |
| Plot type | Count rate plots | Images |
|---|---|---|
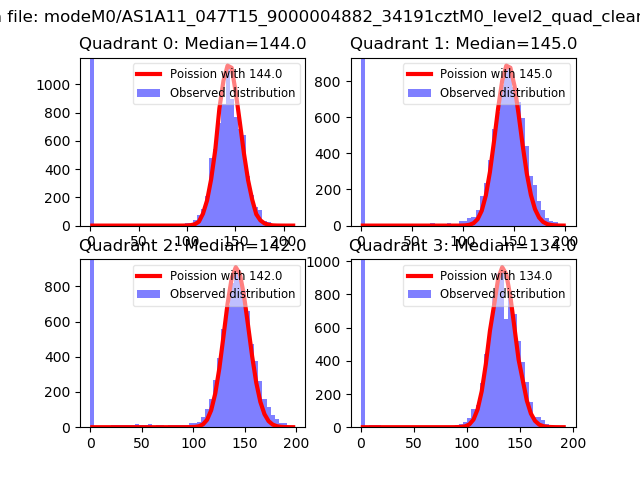
| Comparison with Poisson distribution Blue bars denote a histogram of data divided into 1 sec bins. Red curve is a Poisson curve with rate = median count rate of data. |
 |
 |
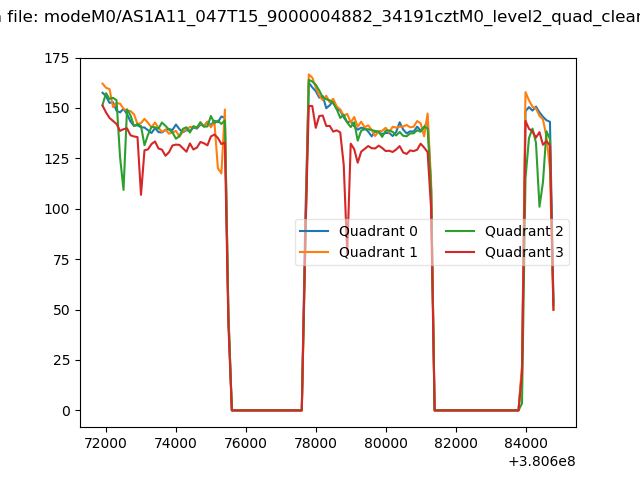
| Quadrant-wise count rates Data is divided into 100 sec bins |
 |
|
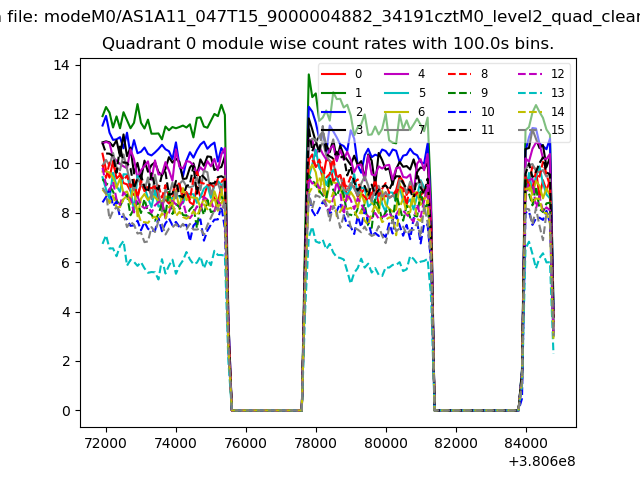
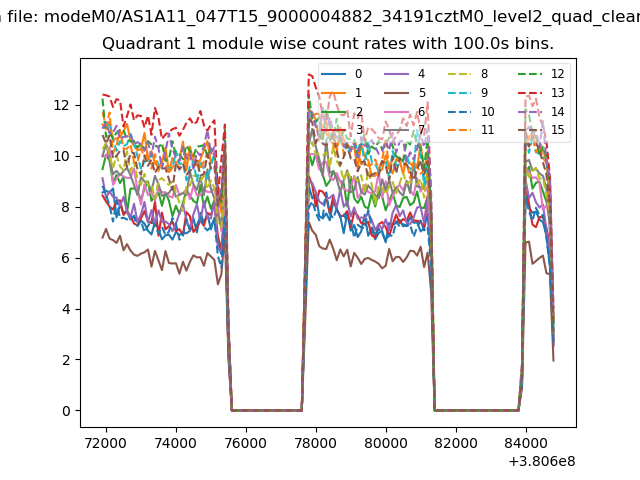
| Module-wise count rates for Quadrant A Data is divided into 100 sec bins |
 |
 |
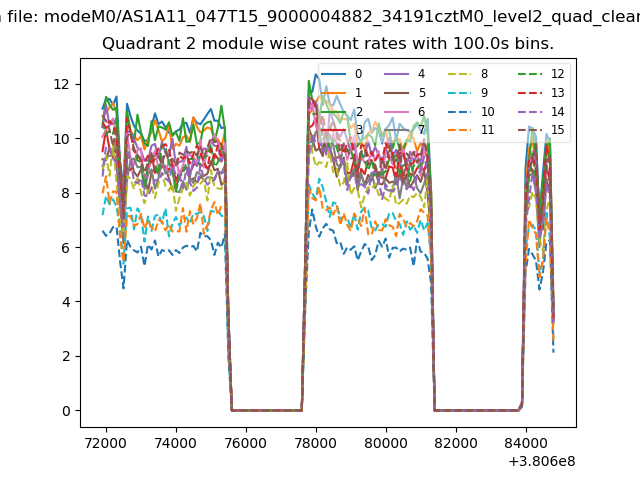
| Module-wise count rates for Quadrant B Data is divided into 100 sec bins |
 |
 |
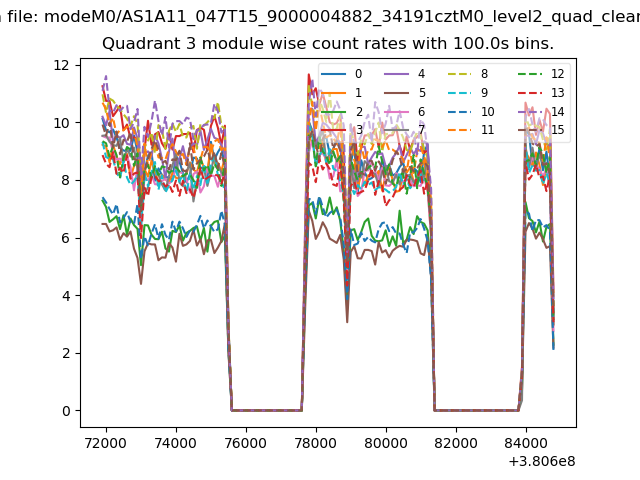
| Module-wise count rates for Quadrant C Data is divided into 100 sec bins |
 |
 |
| Module-wise count rates for Quadrant D Data is divided into 100 sec bins |
 |
 |
| Parameter | Plot |
|---|---|
| CZT HV Monitor | 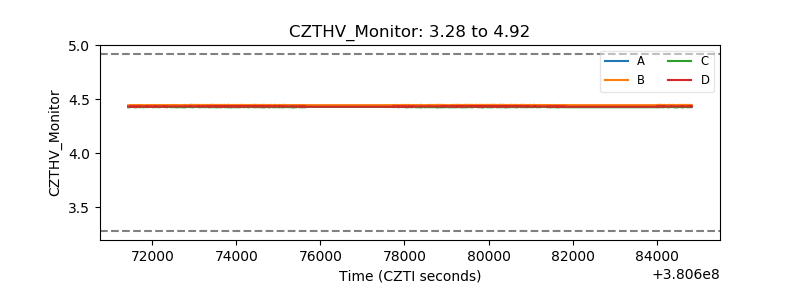 |
| D_VDD | 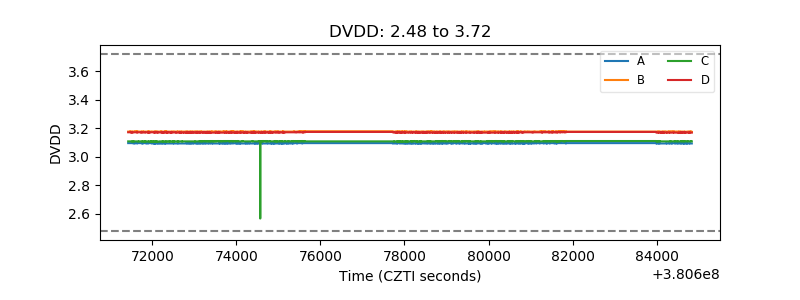 |
| Temperature 1 | 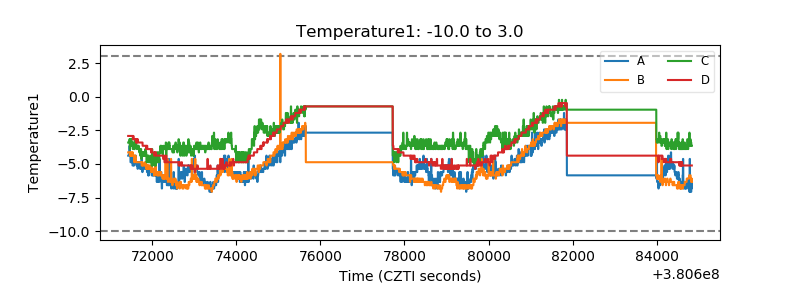 |
| Veto HV Monitor | 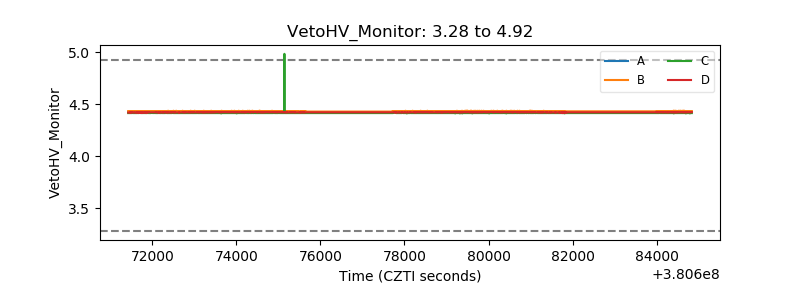 |
| Veto LLD | 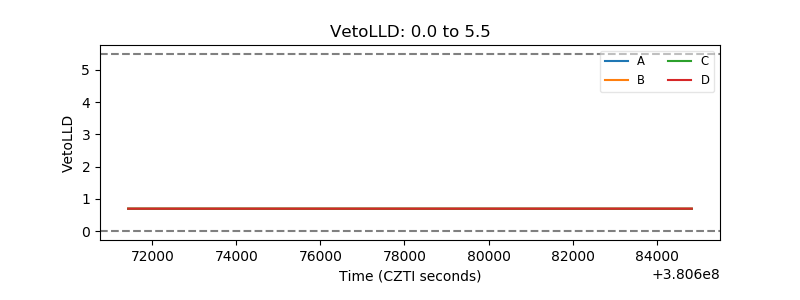 |
| Alpha Counter | 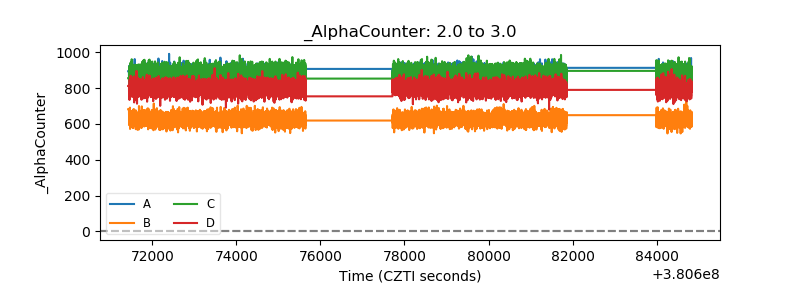 |
| _CPM_Rate | 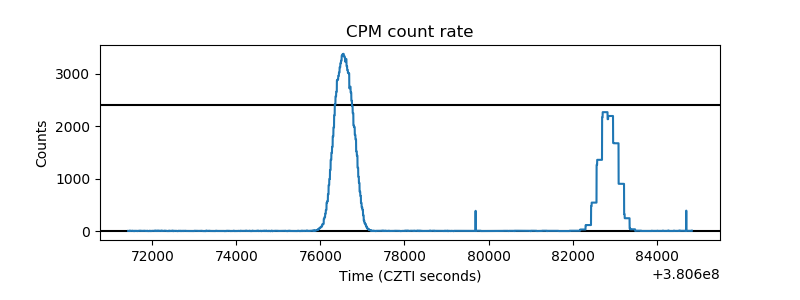 |
| CZT Counter | 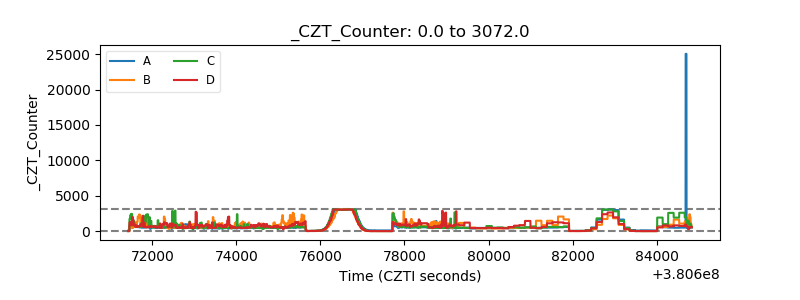 |
| +2.5 Volts monitor |  |
| +5 Volts monitor | 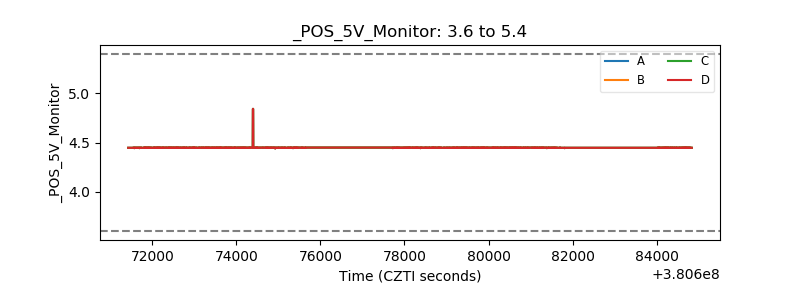 |
| _ROLL_ROT | 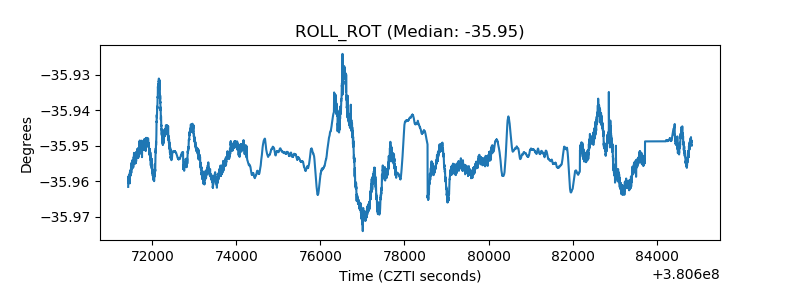 |
| _Roll_DEC | 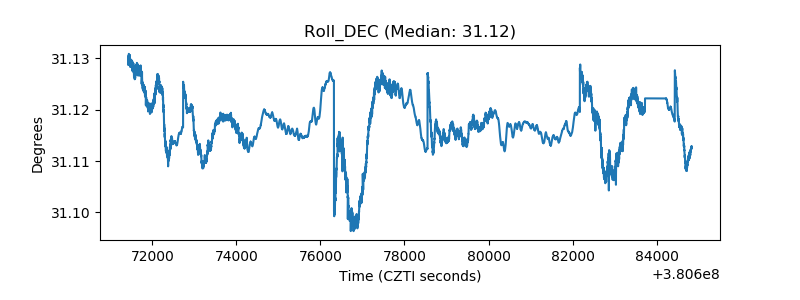 |
| _Roll_RA | 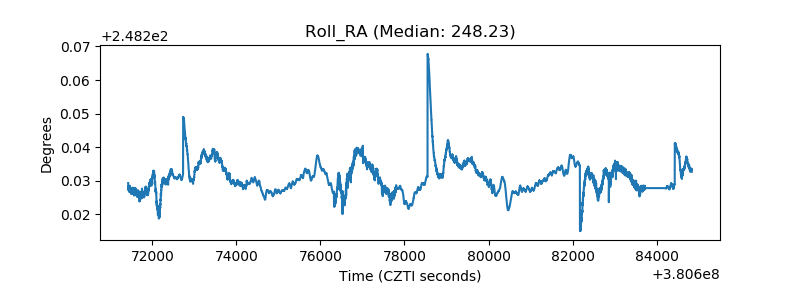 |
| Veto Counter | 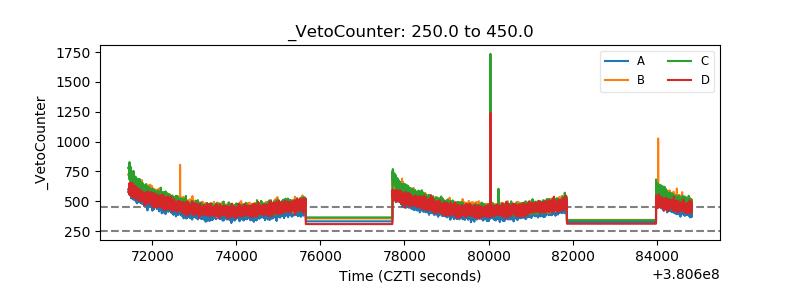 |