| Param | Original file | Final file |
|---|---|---|
| Filename | modeM0/AS1A11_047T15_9000004882_34190cztM0_level2.evt | modeM0/AS1A11_047T15_9000004882_34190cztM0_level2_quad_clean.evt |
| Size (bytes) | 479,312,640 | 92,597,760 |
| Size | 457.1 MB | 88.3 MB |
| Events in quadrant A | 2,584,512 | 626,217 |
| Events in quadrant B | 4,166,460 | 627,778 |
| Events in quadrant C | 3,549,550 | 621,255 |
| Events in quadrant D | 3,882,659 | 584,199 |
| Mode SS | |||
|---|---|---|---|
| Quadrant | BADHDUFLAG | Total packets | Discarded packets |
| A | 0 | 100 | 0 |
| B | 0 | 100 | 0 |
| C | 0 | 100 | 0 |
| D | 0 | 100 | 0 |
| Mode M9 | |||
|---|---|---|---|
| Quadrant | BADHDUFLAG | Total packets | Discarded packets |
| A | 0 | 39 | 0 |
| B | 0 | 39 | 0 |
| C | 0 | 39 | 0 |
| D | 0 | 39 | 0 |
| Mode M0 | |||
|---|---|---|---|
| Quadrant | BADHDUFLAG | Total packets | Discarded packets |
| A | 0 | 10664 | 3 |
| B | 0 | 15819 | 2 |
| C | 0 | 13607 | 2 |
| D | 0 | 14870 | 2 |
| Quadrant | Total seconds | Saturated seconds | Saturation percentage |
|---|---|---|---|
| A | 4916 | 4 | 0.081367% |
| B | 4916 | 298 | 6.061839% |
| C | 4916 | 324 | 6.590724% |
| D | 4916 | 90 | 1.830757% |
Noise dominated data is calculated using 1-second bins in cleaned event files. If a bin has >2000 counts, and if more than 50% of those come from <1% of pixels, then it is considered to be noise-dominated and hence unusable.
| Quadrant | # 1 sec bins | Bins with >0 counts | Bins with >2000 counts | High rate bins dominated by noise | Noise dominated (total time) | Noise dominated (detector-on time) | Marked lightcurve |
|---|---|---|---|---|---|---|---|
| A | 6978 | 4917 | 2 | 2 | 0.03% | 0.04% | 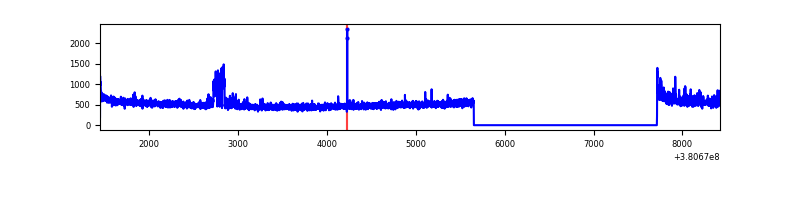 |
| B | 6978 | 4917 | 182 | 182 | 2.61% | 3.70% | 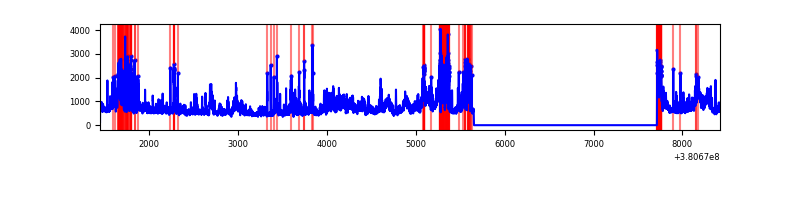 |
| C | 6978 | 4917 | 237 | 237 | 3.40% | 4.82% | 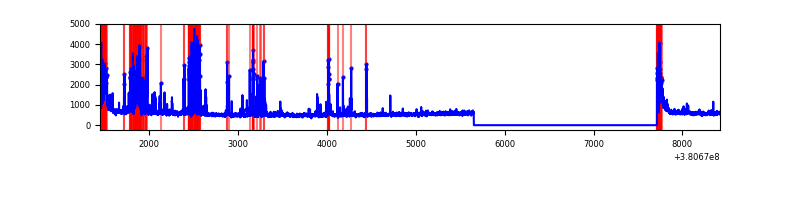 |
| D | 6978 | 4917 | 57 | 57 | 0.82% | 1.16% | 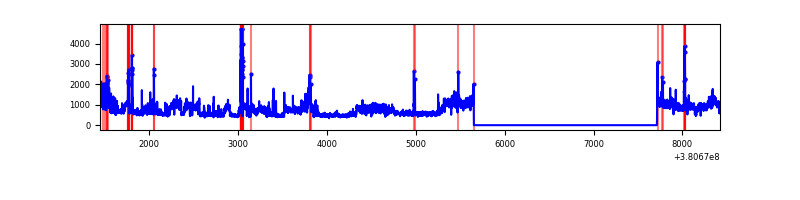 |
Top three noisy pixels from each quadrant. If the there are fewer than three noisy pixels in the level2.evt file, extra rows are filled as -1
| Pixel properties | Quadrant properties | ||||||
|---|---|---|---|---|---|---|---|
| Quadrant | DetID | PixID | Counts | Sigma | Mean | Median | Sigma |
| A | 15 | 169 | 134217 | 1073.19 | 622 | 612 | 124.5 |
| A | 10 | 83 | 21737 | 169.69 | 622 | 612 | 124.5 |
| A | 13 | 6 | 19055 | 148.15 | 622 | 612 | 124.5 |
| B | 5 | 31 | 726768 | 6290.75 | 612 | 600 | 115.4 |
| B | 5 | 172 | 691787 | 5987.71 | 612 | 600 | 115.4 |
| B | 5 | 15 | 244302 | 2111.17 | 612 | 600 | 115.4 |
| C | 14 | 254 | 683380 | 4991.56 | 595 | 602 | 136.8 |
| C | 0 | 10 | 297049 | 2167.22 | 595 | 602 | 136.8 |
| C | 15 | 214 | 220861 | 1610.24 | 595 | 602 | 136.8 |
| D | 8 | 195 | 1135391 | 7381.54 | 595 | 584 | 153.7 |
| D | 13 | 249 | 108165 | 699.78 | 595 | 584 | 153.7 |
| D | 7 | 223 | 61998 | 399.48 | 595 | 584 | 153.7 |
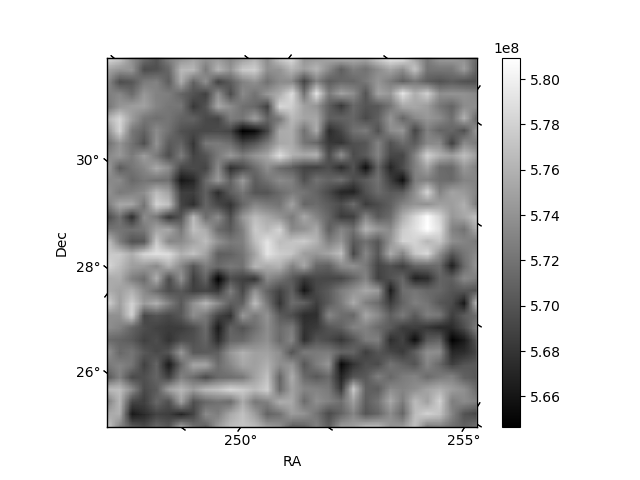
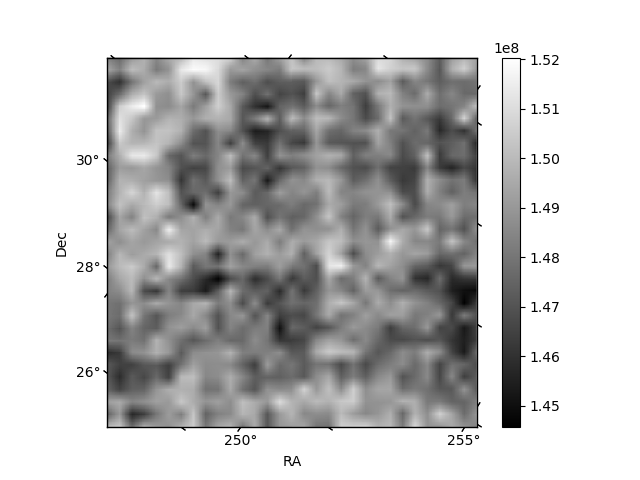
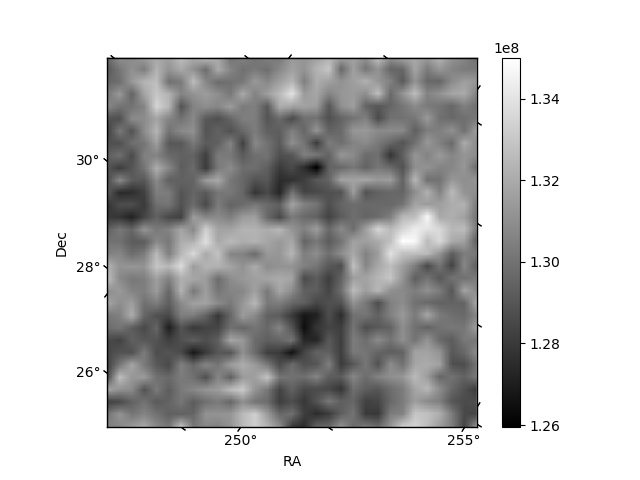
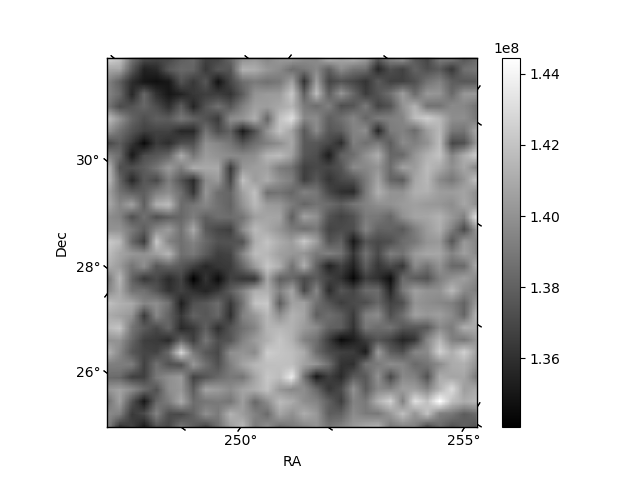
Histogram calculated using DETX and DETY for each event in the final _common_clean file
| Quadrant A | 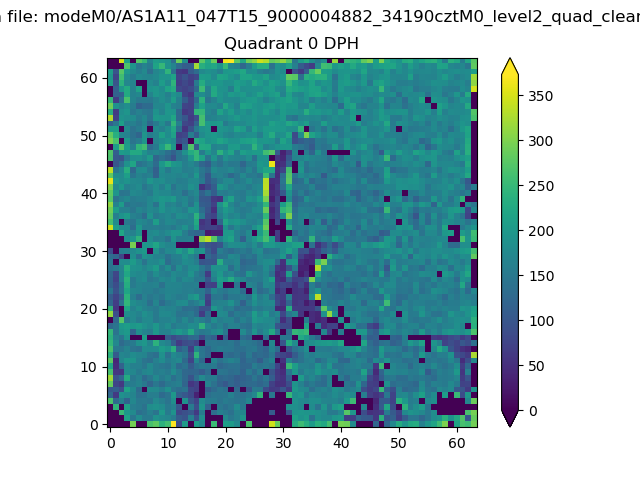 |
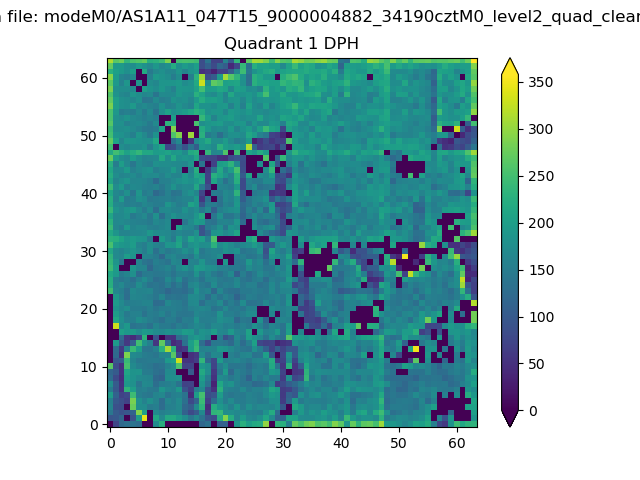 |
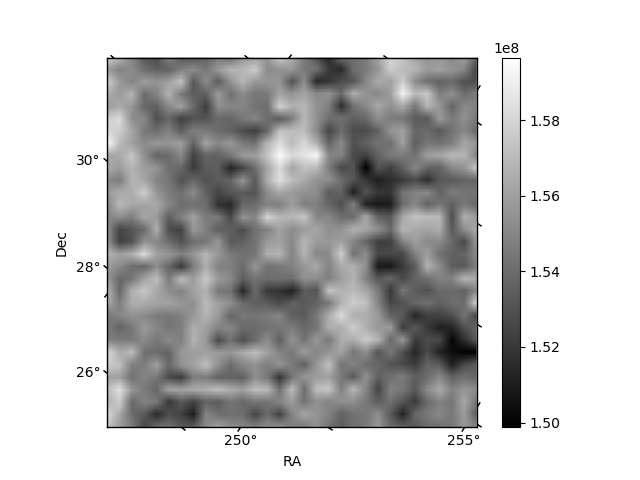
Quadrant B |
|---|---|---|---|
| Quadrant D | 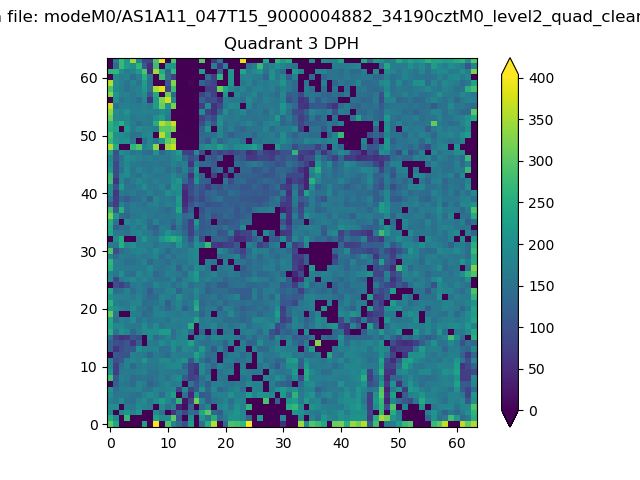 |
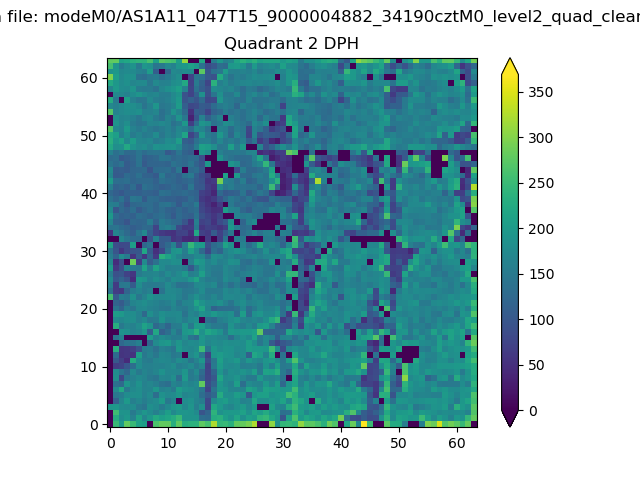 |
Quadrant C |
| Plot type | Count rate plots | Images |
|---|---|---|
| Comparison with Poisson distribution Blue bars denote a histogram of data divided into 1 sec bins. Red curve is a Poisson curve with rate = median count rate of data. |
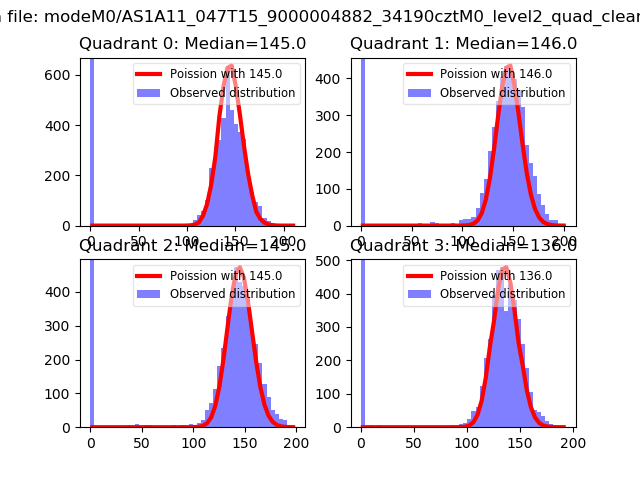 |
 |
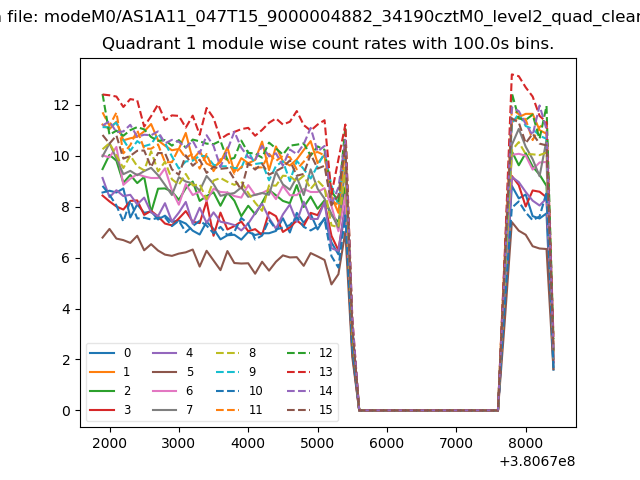
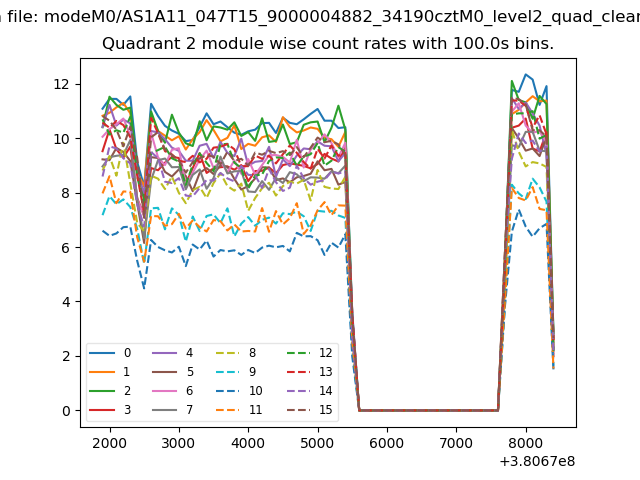
| Quadrant-wise count rates Data is divided into 100 sec bins |
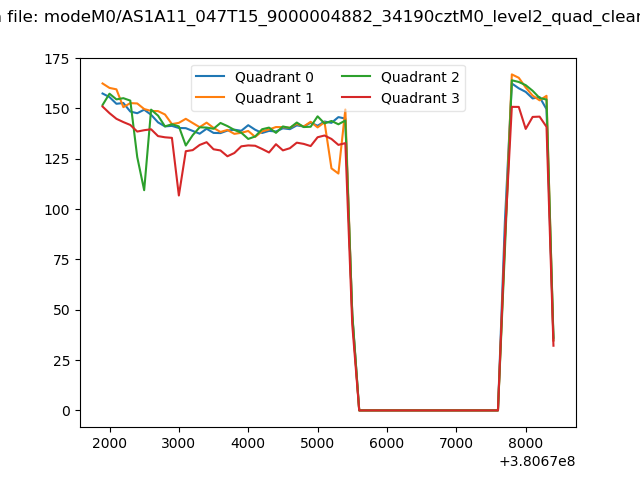 |
|
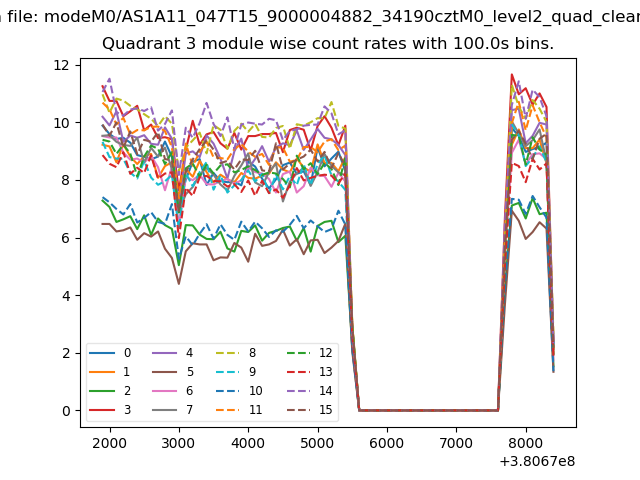
| Module-wise count rates for Quadrant A Data is divided into 100 sec bins |
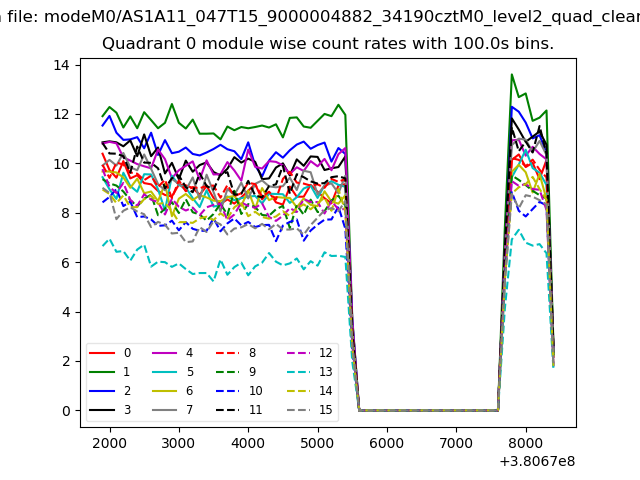 |
 |
| Module-wise count rates for Quadrant B Data is divided into 100 sec bins |
 |
 |
| Module-wise count rates for Quadrant C Data is divided into 100 sec bins |
 |
 |
| Module-wise count rates for Quadrant D Data is divided into 100 sec bins |
 |
 |
| Parameter | Plot |
|---|---|
| CZT HV Monitor | 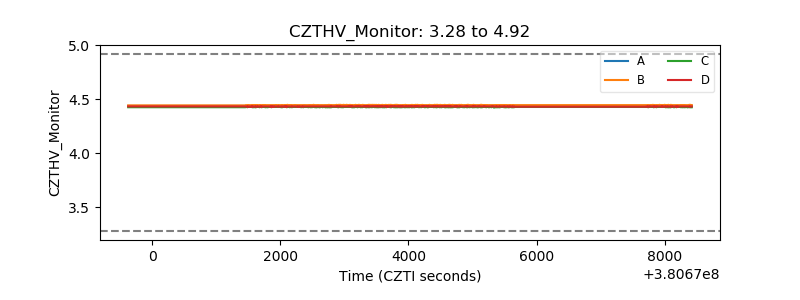 |
| D_VDD | 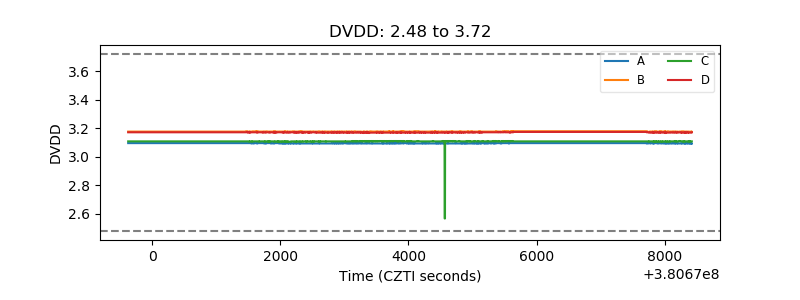 |
| Temperature 1 | 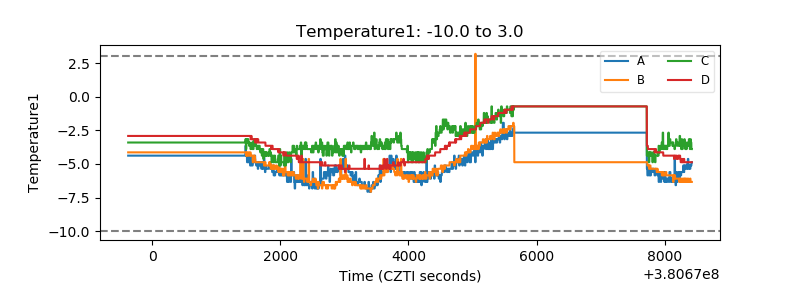 |
| Veto HV Monitor | 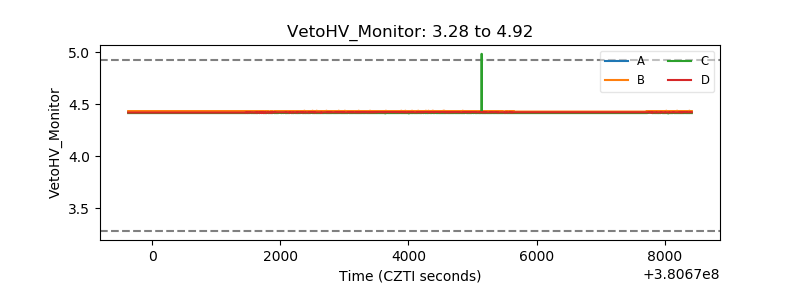 |
| Veto LLD | 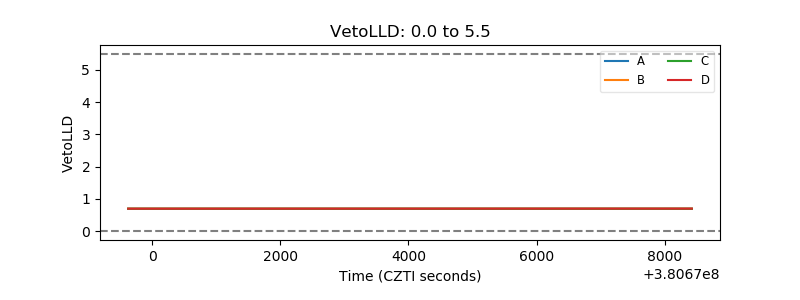 |
| Alpha Counter | 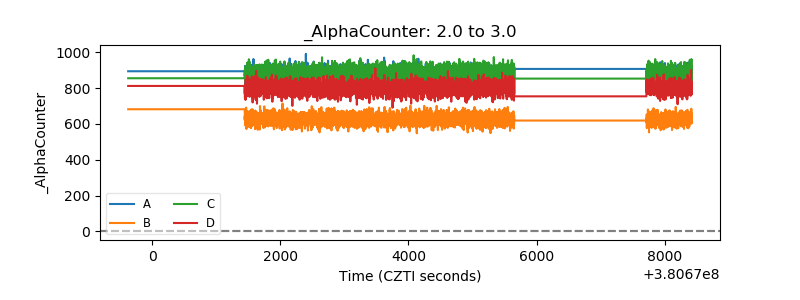 |
| _CPM_Rate | 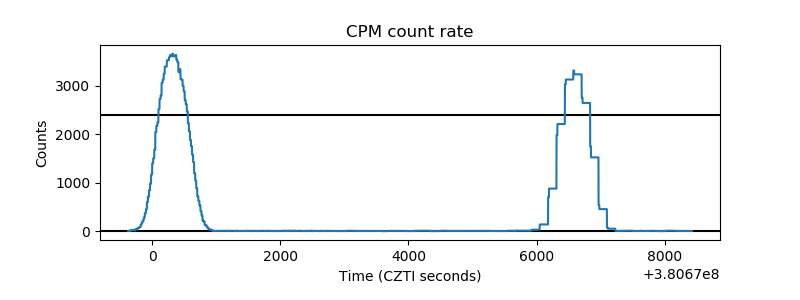 |
| CZT Counter | 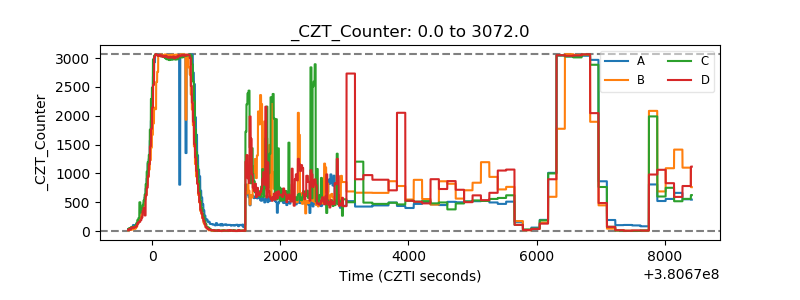 |
| +2.5 Volts monitor | 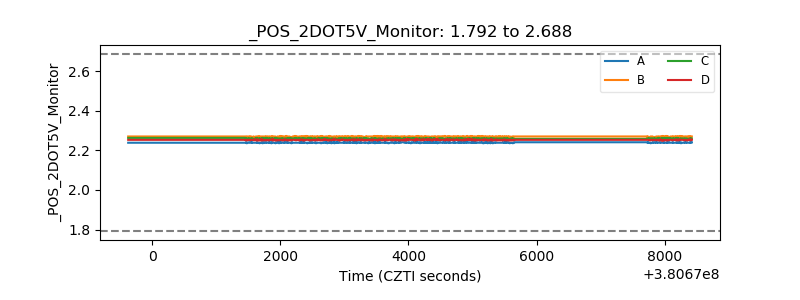 |
| +5 Volts monitor | 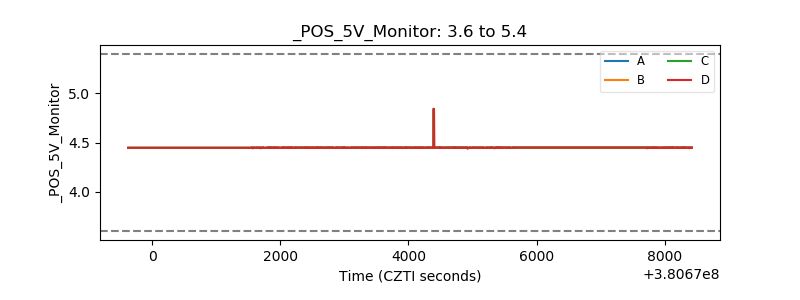 |
| _ROLL_ROT | 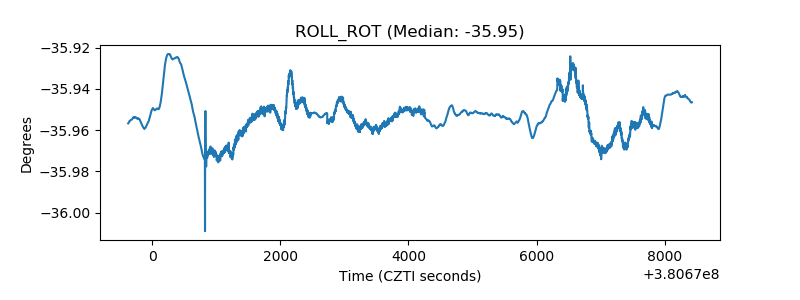 |
| _Roll_DEC | 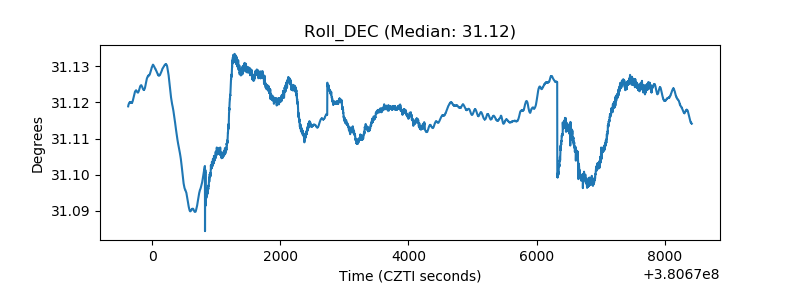 |
| _Roll_RA | 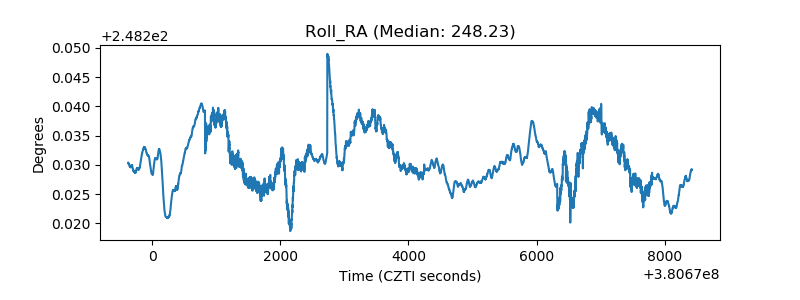 |
| Veto Counter | 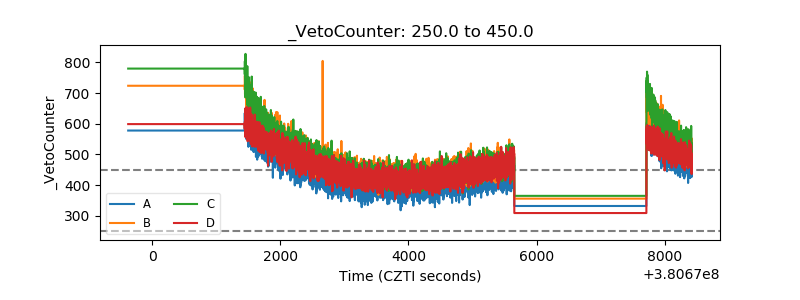 |