| Param | Original file | Final file |
|---|---|---|
| Filename | modeM0/AS1A11_047T15_9000004882cztM0_level2_bc.evt | modeM0/AS1A11_047T15_9000004882cztM0_level2_quad_clean.evt |
| Size (bytes) | 8,214,229,440 | 1,920,749,760 |
| Size | 7.7 GB | 1.8 GB |
| Events in quadrant A | 31,396,561 | 12,482,559 |
| Events in quadrant B | 69,184,742 | 12,311,571 |
| Events in quadrant C | 57,530,276 | 12,175,194 |
| Events in quadrant D | 80,962,128 | 11,416,247 |
| Mode SS | |||
|---|---|---|---|
| Quadrant | BADHDUFLAG | Total packets | Discarded packets |
| A | 0 | 2922 | 0 |
| B | 0 | 2922 | 0 |
| C | 0 | 2922 | 0 |
| D | 0 | 2922 | 0 |
| Mode M9 | |||
|---|---|---|---|
| Quadrant | BADHDUFLAG | Total packets | Discarded packets |
| A | 0 | 551 | 0 |
| B | 0 | 551 | 0 |
| C | 0 | 551 | 0 |
| D | 0 | 551 | 0 |
| Mode M0 | |||
|---|---|---|---|
| Quadrant | BADHDUFLAG | Total packets | Discarded packets |
| A | 0 | 294369 | 0 |
| B | 0 | 465275 | 0 |
| C | 0 | 382139 | 0 |
| D | 0 | 468484 | 0 |
| Quadrant | Total seconds | Saturated seconds | Saturation percentage |
|---|---|---|---|
| A | 142911 | 493 | 0.344970% |
| B | 142911 | 16799 | 11.754868% |
| C | 142911 | 6146 | 4.300579% |
| D | 142911 | 8113 | 5.676960% |
Noise dominated data is calculated using 1-second bins in cleaned event files. If a bin has >2000 counts, and if more than 50% of those come from <1% of pixels, then it is considered to be noise-dominated and hence unusable.
| Quadrant | # 1 sec bins | Bins with >0 counts | Bins with >2000 counts | High rate bins dominated by noise | Noise dominated (total time) | Noise dominated (detector-on time) | Marked lightcurve |
|---|---|---|---|---|---|---|---|
| A | 197972 | 142933 | 44 | 44 | 0.02% | 0.03% |  |
| B | 197972 | 142914 | 437 | 437 | 0.22% | 0.31% |  |
| C | 197972 | 142914 | 876 | 876 | 0.44% | 0.61% |  |
| D | 197972 | 142909 | 818 | 818 | 0.41% | 0.57% |  |
Top three noisy pixels from each quadrant. If the there are fewer than three noisy pixels in the level2.evt file, extra rows are filled as -1
| Pixel properties | Quadrant properties | ||||||
|---|---|---|---|---|---|---|---|
| Quadrant | DetID | PixID | Counts | Sigma | Mean | Median | Sigma |
| A | 15 | 169 | 850616 | 506.92 | 7587 | 7460 | 1663.3 |
| A | 10 | 83 | 366942 | 216.13 | 7587 | 7460 | 1663.3 |
| A | 13 | 6 | 358462 | 211.03 | 7587 | 7460 | 1663.3 |
| B | 5 | 31 | 18008807 | 12485.74 | 7324 | 7167 | 1441.8 |
| B | 5 | 15 | 8916170 | 6179.19 | 7324 | 7167 | 1441.8 |
| B | 5 | 172 | 8425773 | 5839.05 | 7324 | 7167 | 1441.8 |
| C | 0 | 239 | 12726488 | 7714.1 | 7309 | 7268 | 1648.8 |
| C | 15 | 214 | 6029230 | 3652.27 | 7309 | 7268 | 1648.8 |
| C | 0 | 10 | 5261011 | 3186.35 | 7309 | 7268 | 1648.8 |
| D | 8 | 195 | 28395767 | 16254.56 | 7250 | 7031 | 1746.5 |
| D | 2 | 249 | 4813908 | 2752.28 | 7250 | 7031 | 1746.5 |
| D | 10 | 118 | 3838774 | 2193.94 | 7250 | 7031 | 1746.5 |
Histogram calculated using DETX and DETY for each event in the final _common_clean file
| Quadrant A |  |
 |
Quadrant B |
|---|---|---|---|
| Quadrant D |  |
 |
Quadrant C |
| Plot type | Count rate plots | Images |
|---|---|---|
| Comparison with Poisson distribution Blue bars denote a histogram of data divided into 1 sec bins. Red curve is a Poisson curve with rate = median count rate of data. |
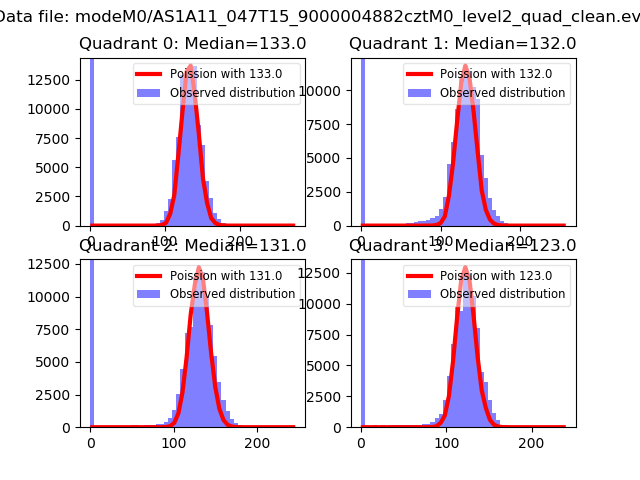 |
 |
| Quadrant-wise count rates Data is divided into 100 sec bins |
 |
|
| Module-wise count rates for Quadrant A Data is divided into 100 sec bins |
 |
 |
| Module-wise count rates for Quadrant B Data is divided into 100 sec bins |
 |
 |
| Module-wise count rates for Quadrant C Data is divided into 100 sec bins |
 |
 |
| Module-wise count rates for Quadrant D Data is divided into 100 sec bins |
 |
 |
| Parameter | Plot |
|---|---|
| CZT HV Monitor |  |
| D_VDD | 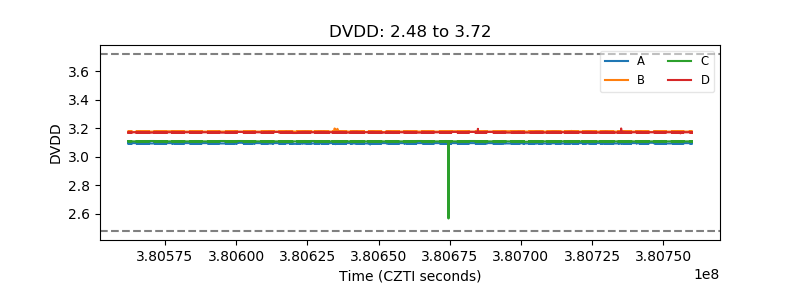 |
| Temperature 1 |  |
| Veto HV Monitor |  |
| Veto LLD |  |
| Alpha Counter |  |
| _CPM_Rate | 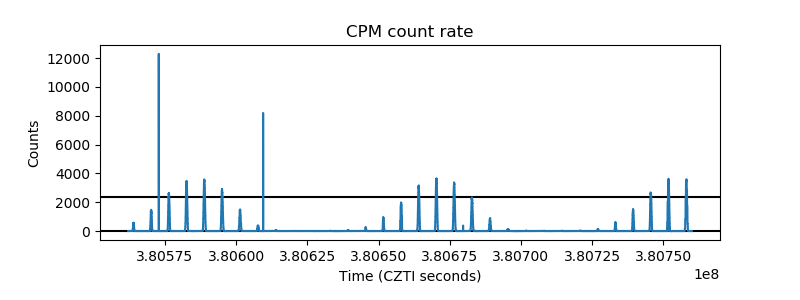 |
| CZT Counter |  |
| +2.5 Volts monitor | 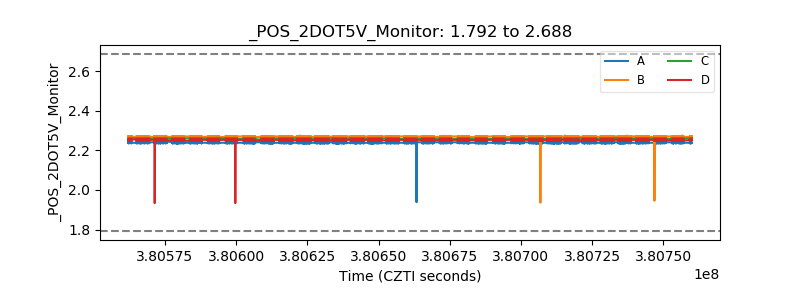 |
| +5 Volts monitor |  |
| _ROLL_ROT |  |
| _Roll_DEC |  |
| _Roll_RA |  |
| Veto Counter | 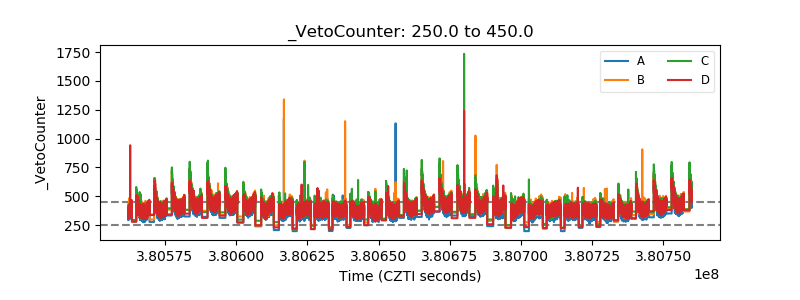 |