| Param | Original file | Final file |
|---|---|---|
| Filename | modeM0/AS1A11_054T07_9000004878cztM0_level2_bc.evt | modeM0/AS1A11_054T07_9000004878cztM0_level2_quad_clean.evt |
| Size (bytes) | 2,044,463,040 | 643,639,680 |
| Size | 1.9 GB | 613.8 MB |
| Events in quadrant A | 9,233,409 | 4,153,222 |
| Events in quadrant B | 15,360,884 | 4,222,635 |
| Events in quadrant C | 14,064,175 | 4,137,693 |
| Events in quadrant D | 20,204,224 | 3,902,724 |
| Mode SS | |||
|---|---|---|---|
| Quadrant | BADHDUFLAG | Total packets | Discarded packets |
| A | 0 | 914 | 0 |
| B | 0 | 914 | 0 |
| C | 0 | 914 | 0 |
| D | 0 | 914 | 0 |
| Mode M0 | |||
|---|---|---|---|
| Quadrant | BADHDUFLAG | Total packets | Discarded packets |
| A | 0 | 90777 | 0 |
| B | 0 | 118172 | 0 |
| C | 0 | 103325 | 0 |
| D | 0 | 125898 | 0 |
| Mode M9 | |||
|---|---|---|---|
| Quadrant | BADHDUFLAG | Total packets | Discarded packets |
| A | 0 | 157 | 0 |
| B | 0 | 157 | 0 |
| C | 0 | 157 | 0 |
| D | 0 | 157 | 0 |
| Quadrant | Total seconds | Saturated seconds | Saturation percentage |
|---|---|---|---|
| A | 44875 | 36 | 0.080223% |
| B | 44875 | 2079 | 4.632869% |
| C | 44875 | 824 | 1.836212% |
| D | 44875 | 1003 | 2.235097% |
Noise dominated data is calculated using 1-second bins in cleaned event files. If a bin has >2000 counts, and if more than 50% of those come from <1% of pixels, then it is considered to be noise-dominated and hence unusable.
| Quadrant | # 1 sec bins | Bins with >0 counts | Bins with >2000 counts | High rate bins dominated by noise | Noise dominated (total time) | Noise dominated (detector-on time) | Marked lightcurve |
|---|---|---|---|---|---|---|---|
| A | 59472 | 44878 | 0 | 0 | 0.00% | 0.00% |  |
| B | 59472 | 44874 | 47 | 47 | 0.08% | 0.10% |  |
| C | 59472 | 44874 | 162 | 162 | 0.27% | 0.36% |  |
| D | 59472 | 44874 | 228 | 228 | 0.38% | 0.51% |  |
Top three noisy pixels from each quadrant. If the there are fewer than three noisy pixels in the level2.evt file, extra rows are filled as -1
| Pixel properties | Quadrant properties | ||||||
|---|---|---|---|---|---|---|---|
| Quadrant | DetID | PixID | Counts | Sigma | Mean | Median | Sigma |
| A | 10 | 83 | 107630 | 204.4 | 2326 | 2284 | 515.4 |
| A | 13 | 6 | 86723 | 163.84 | 2326 | 2284 | 515.4 |
| A | 13 | 254 | 76699 | 144.39 | 2326 | 2284 | 515.4 |
| B | 5 | 31 | 2322233 | 5010.4 | 2333 | 2283 | 463.0 |
| B | 5 | 15 | 1307093 | 2818.0 | 2333 | 2283 | 463.0 |
| B | 5 | 255 | 1047113 | 2256.52 | 2333 | 2283 | 463.0 |
| C | 0 | 10 | 2463898 | 4737.43 | 2271 | 2256 | 519.6 |
| C | 15 | 214 | 1798593 | 3457.05 | 2271 | 2256 | 519.6 |
| C | 0 | 239 | 517577 | 991.74 | 2271 | 2256 | 519.6 |
| D | 8 | 195 | 7486135 | 13669.83 | 2265 | 2191 | 547.5 |
| D | 8 | 230 | 754468 | 1374.07 | 2265 | 2191 | 547.5 |
| D | 10 | 118 | 482563 | 877.43 | 2265 | 2191 | 547.5 |
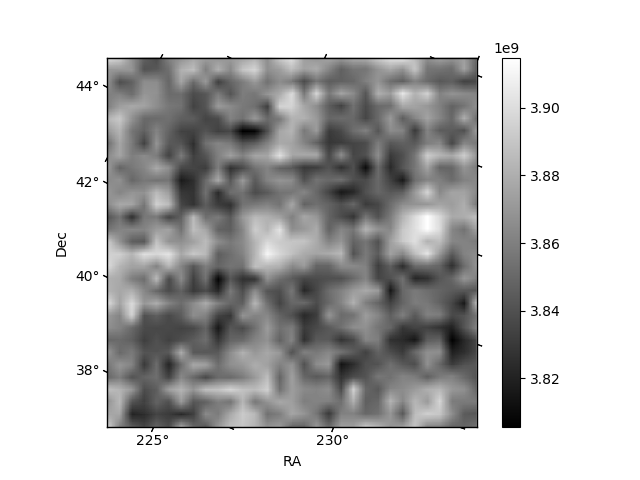
Histogram calculated using DETX and DETY for each event in the final _common_clean file
| Quadrant A |  |
 |
Quadrant B |
|---|---|---|---|
| Quadrant D |  |
 |
Quadrant C |
| Plot type | Count rate plots | Images |
|---|---|---|
| Comparison with Poisson distribution Blue bars denote a histogram of data divided into 1 sec bins. Red curve is a Poisson curve with rate = median count rate of data. |
 |
 |
| Quadrant-wise count rates Data is divided into 100 sec bins |
 |
|
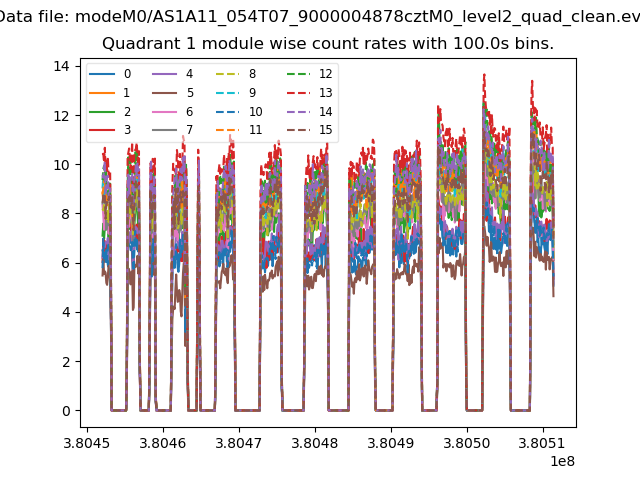
| Module-wise count rates for Quadrant A Data is divided into 100 sec bins |
 |
 |
| Module-wise count rates for Quadrant B Data is divided into 100 sec bins |
 |
 |
| Module-wise count rates for Quadrant C Data is divided into 100 sec bins |
 |
 |
| Module-wise count rates for Quadrant D Data is divided into 100 sec bins |
 |
 |
| Parameter | Plot |
|---|---|
| CZT HV Monitor | 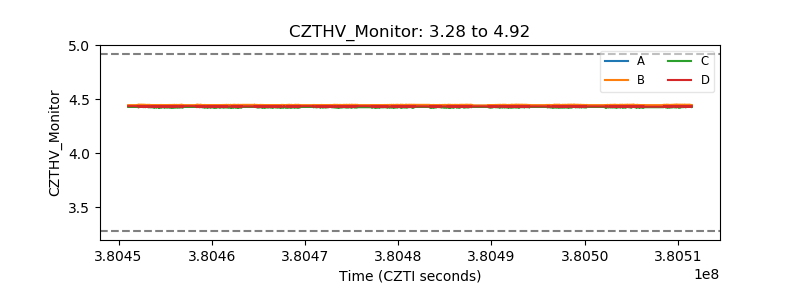 |
| D_VDD |  |
| Temperature 1 |  |
| Veto HV Monitor |  |
| Veto LLD |  |
| Alpha Counter | 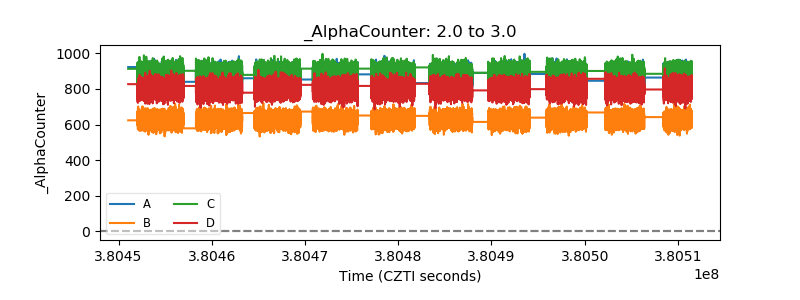 |
| _CPM_Rate |  |
| CZT Counter |  |
| +2.5 Volts monitor |  |
| +5 Volts monitor |  |
| _ROLL_ROT | 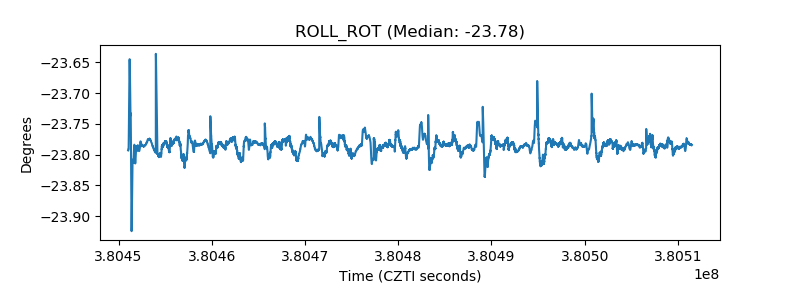 |
| _Roll_DEC |  |
| _Roll_RA |  |
| Veto Counter | 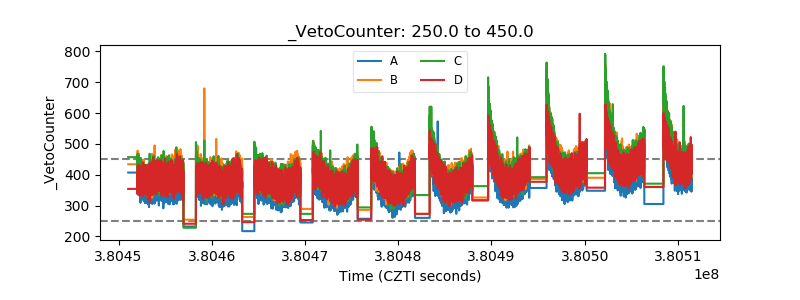 |