| Param | Original file | Final file |
|---|---|---|
| Filename | modeM0/AS1A11_059T05_9000004876cztM0_level2_bc.evt | modeM0/AS1A11_059T05_9000004876cztM0_level2_quad_clean.evt |
| Size (bytes) | 3,313,252,800 | 671,143,680 |
| Size | 3.1 GB | 640.1 MB |
| Events in quadrant A | 12,412,295 | 4,307,153 |
| Events in quadrant B | 37,813,515 | 3,767,083 |
| Events in quadrant C | 19,128,857 | 4,279,251 |
| Events in quadrant D | 27,038,199 | 3,991,668 |
| Mode M9 | |||
|---|---|---|---|
| Quadrant | BADHDUFLAG | Total packets | Discarded packets |
| A | 0 | 224 | 0 |
| B | 0 | 224 | 0 |
| C | 0 | 224 | 0 |
| D | 0 | 224 | 0 |
| Mode M0 | |||
|---|---|---|---|
| Quadrant | BADHDUFLAG | Total packets | Discarded packets |
| A | 0 | 118611 | 0 |
| B | 0 | 263288 | 0 |
| C | 0 | 138937 | 0 |
| D | 0 | 168054 | 0 |
| Mode SS | |||
|---|---|---|---|
| Quadrant | BADHDUFLAG | Total packets | Discarded packets |
| A | 0 | 1184 | 0 |
| B | 0 | 1184 | 0 |
| C | 0 | 1184 | 0 |
| D | 0 | 1184 | 0 |
| Quadrant | Total seconds | Saturated seconds | Saturation percentage |
|---|---|---|---|
| A | 57991 | 60 | 0.103464% |
| B | 57991 | 20458 | 35.277888% |
| C | 57991 | 1101 | 1.898570% |
| D | 57991 | 1710 | 2.948733% |
Noise dominated data is calculated using 1-second bins in cleaned event files. If a bin has >2000 counts, and if more than 50% of those come from <1% of pixels, then it is considered to be noise-dominated and hence unusable.
| Quadrant | # 1 sec bins | Bins with >0 counts | Bins with >2000 counts | High rate bins dominated by noise | Noise dominated (total time) | Noise dominated (detector-on time) | Marked lightcurve |
|---|---|---|---|---|---|---|---|
| A | 78876 | 57999 | 1 | 1 | 0.00% | 0.00% | 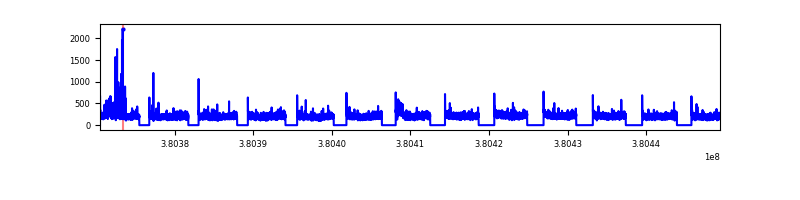 |
| B | 78875 | 57991 | 1158 | 1158 | 1.47% | 2.00% |  |
| C | 78875 | 57990 | 103 | 103 | 0.13% | 0.18% | 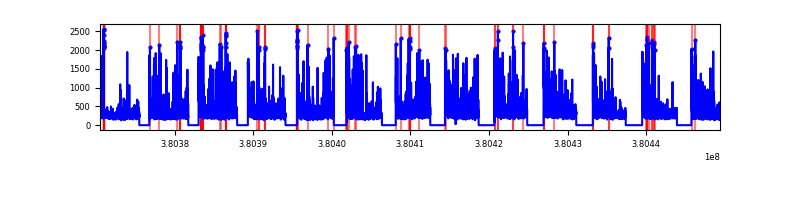 |
| D | 78875 | 57991 | 99 | 99 | 0.13% | 0.17% |  |
Top three noisy pixels from each quadrant. If the there are fewer than three noisy pixels in the level2.evt file, extra rows are filled as -1
| Pixel properties | Quadrant properties | ||||||
|---|---|---|---|---|---|---|---|
| Quadrant | DetID | PixID | Counts | Sigma | Mean | Median | Sigma |
| A | 15 | 169 | 455033 | 675.27 | 3032 | 2977 | 669.4 |
| A | 10 | 83 | 136463 | 199.4 | 3032 | 2977 | 669.4 |
| A | 13 | 6 | 106740 | 155.0 | 3032 | 2977 | 669.4 |
| B | 5 | 31 | 16596978 | 31814.94 | 2629 | 2571 | 521.6 |
| B | 5 | 15 | 8943518 | 17141.66 | 2629 | 2571 | 521.6 |
| B | 5 | 172 | 775712 | 1482.27 | 2629 | 2571 | 521.6 |
| C | 0 | 10 | 3240301 | 4781.81 | 2983 | 2957 | 677.0 |
| C | 15 | 214 | 2347639 | 3463.28 | 2983 | 2957 | 677.0 |
| C | 14 | 254 | 1240646 | 1828.16 | 2983 | 2957 | 677.0 |
| D | 8 | 195 | 9477566 | 13352.66 | 2965 | 2868 | 709.6 |
| D | 10 | 118 | 2522624 | 3551.08 | 2965 | 2868 | 709.6 |
| D | 7 | 223 | 793822 | 1114.69 | 2965 | 2868 | 709.6 |
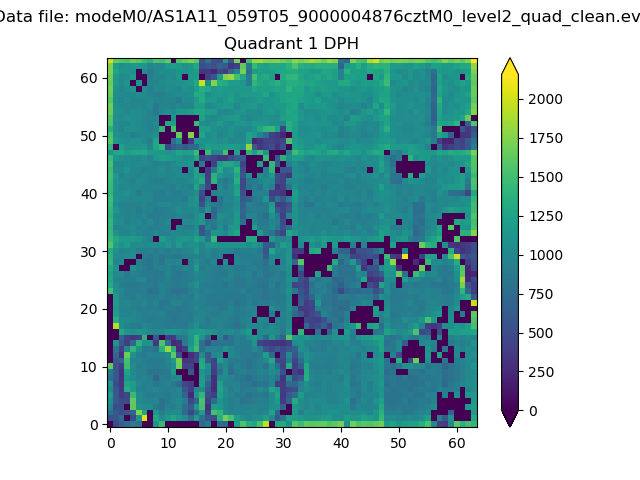
Histogram calculated using DETX and DETY for each event in the final _common_clean file
| Quadrant A |  |
 |
Quadrant B |
|---|---|---|---|
| Quadrant D | 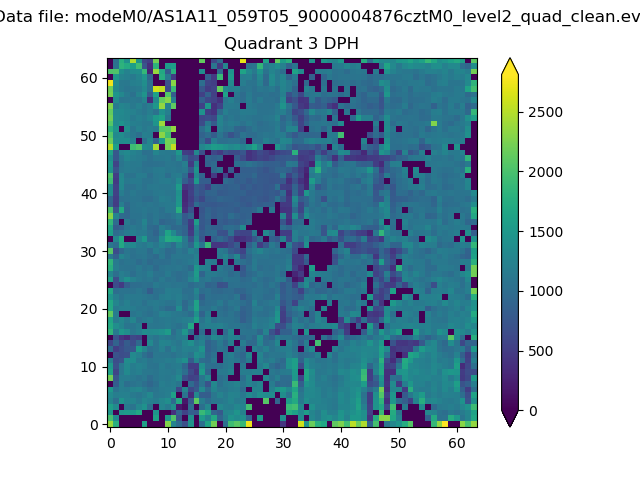 |
 |
Quadrant C |
| Plot type | Count rate plots | Images |
|---|---|---|
| Comparison with Poisson distribution Blue bars denote a histogram of data divided into 1 sec bins. Red curve is a Poisson curve with rate = median count rate of data. |
 |
 |
| Quadrant-wise count rates Data is divided into 100 sec bins |
 |
|
| Module-wise count rates for Quadrant A Data is divided into 100 sec bins |
 |
 |
| Module-wise count rates for Quadrant B Data is divided into 100 sec bins |
 |
 |
| Module-wise count rates for Quadrant C Data is divided into 100 sec bins |
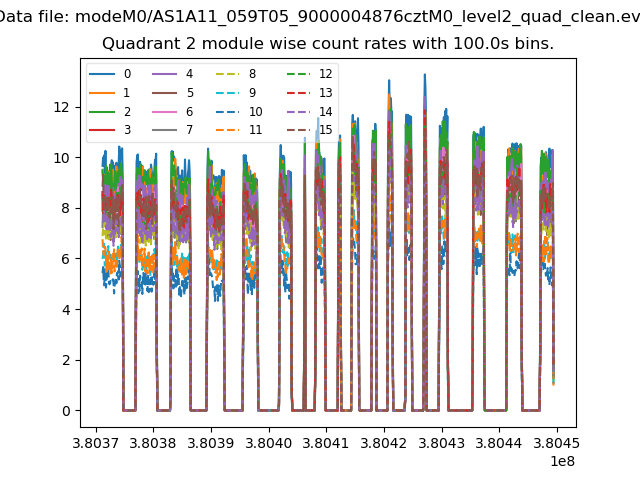 |
 |
| Module-wise count rates for Quadrant D Data is divided into 100 sec bins |
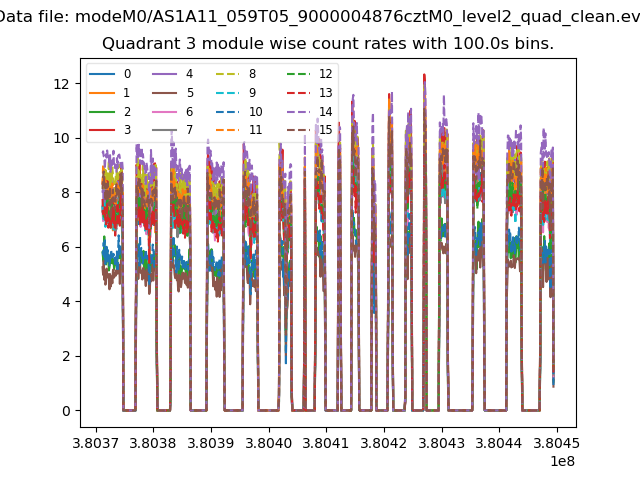 |
 |
| Parameter | Plot |
|---|---|
| CZT HV Monitor | 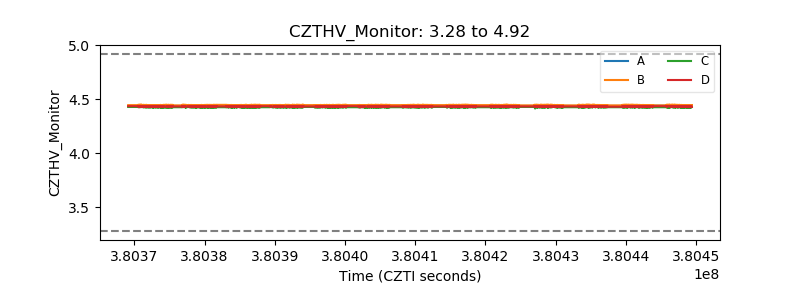 |
| D_VDD |  |
| Temperature 1 |  |
| Veto HV Monitor |  |
| Veto LLD |  |
| Alpha Counter |  |
| _CPM_Rate |  |
| CZT Counter |  |
| +2.5 Volts monitor |  |
| +5 Volts monitor | 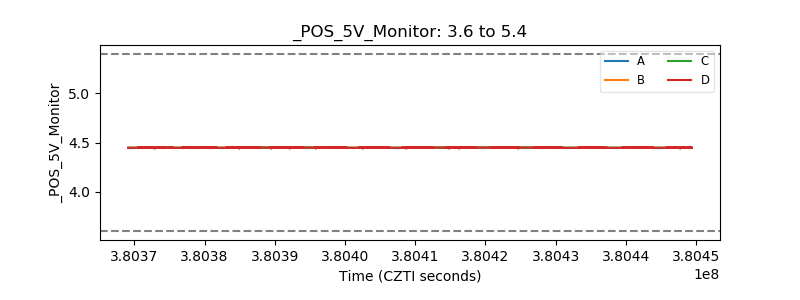 |
| _ROLL_ROT |  |
| _Roll_DEC |  |
| _Roll_RA | 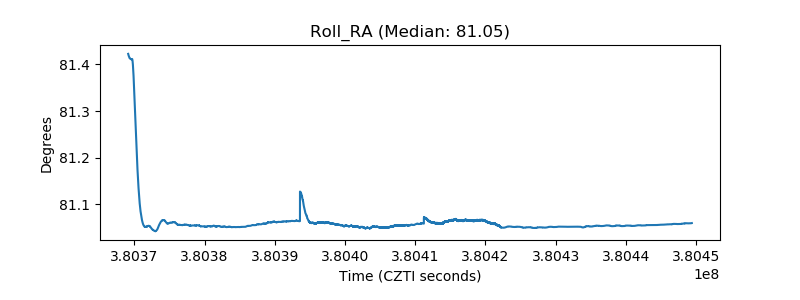 |
| Veto Counter |  |