| Param | Original file | Final file |
|---|---|---|
| Filename | modeM0/AS1T04_093T01_9000004872cztM0_level2_bc.evt | modeM0/AS1T04_093T01_9000004872cztM0_level2_quad_clean.evt |
| Size (bytes) | 1,136,528,640 | 266,158,080 |
| Size | 1.1 GB | 253.8 MB |
| Events in quadrant A | 4,428,866 | 1,698,388 |
| Events in quadrant B | 8,389,880 | 1,657,086 |
| Events in quadrant C | 8,985,264 | 1,620,043 |
| Events in quadrant D | 11,133,786 | 1,589,609 |
| Mode M0 | |||
|---|---|---|---|
| Quadrant | BADHDUFLAG | Total packets | Discarded packets |
| A | 0 | 43890 | 0 |
| B | 0 | 60523 | 0 |
| C | 0 | 59428 | 0 |
| D | 0 | 66619 | 0 |
| Mode SS | |||
|---|---|---|---|
| Quadrant | BADHDUFLAG | Total packets | Discarded packets |
| A | 0 | 442 | 0 |
| B | 0 | 442 | 0 |
| C | 0 | 442 | 0 |
| D | 0 | 442 | 0 |
| Mode M9 | |||
|---|---|---|---|
| Quadrant | BADHDUFLAG | Total packets | Discarded packets |
| A | 0 | 72 | 0 |
| B | 0 | 72 | 0 |
| C | 0 | 72 | 0 |
| D | 0 | 72 | 0 |
| Quadrant | Total seconds | Saturated seconds | Saturation percentage |
|---|---|---|---|
| A | 21728 | 29 | 0.133468% |
| B | 21727 | 1600 | 7.364109% |
| C | 21728 | 1204 | 5.541237% |
| D | 21728 | 863 | 3.971834% |
Noise dominated data is calculated using 1-second bins in cleaned event files. If a bin has >2000 counts, and if more than 50% of those come from <1% of pixels, then it is considered to be noise-dominated and hence unusable.
| Quadrant | # 1 sec bins | Bins with >0 counts | Bins with >2000 counts | High rate bins dominated by noise | Noise dominated (total time) | Noise dominated (detector-on time) | Marked lightcurve |
|---|---|---|---|---|---|---|---|
| A | 27458 | 21730 | 0 | 0 | 0.00% | 0.00% | 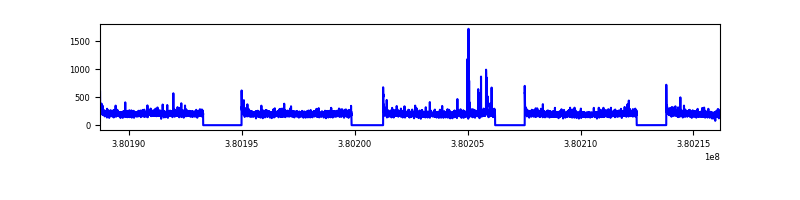 |
| B | 27458 | 21727 | 35 | 35 | 0.13% | 0.16% |  |
| C | 27458 | 21727 | 225 | 225 | 0.82% | 1.04% |  |
| D | 27458 | 21723 | 76 | 76 | 0.28% | 0.35% |  |
Top three noisy pixels from each quadrant. If the there are fewer than three noisy pixels in the level2.evt file, extra rows are filled as -1
| Pixel properties | Quadrant properties | ||||||
|---|---|---|---|---|---|---|---|
| Quadrant | DetID | PixID | Counts | Sigma | Mean | Median | Sigma |
| A | 13 | 6 | 58334 | 233.5 | 1101 | 1081 | 245.2 |
| A | 10 | 83 | 52221 | 208.57 | 1101 | 1081 | 245.2 |
| A | 15 | 169 | 46764 | 186.31 | 1101 | 1081 | 245.2 |
| B | 5 | 172 | 3200904 | 14782.59 | 1072 | 1048 | 216.5 |
| B | 0 | 189 | 273395 | 1258.18 | 1072 | 1048 | 216.5 |
| B | 0 | 219 | 155237 | 712.32 | 1072 | 1048 | 216.5 |
| C | 0 | 10 | 1863962 | 7853.14 | 1041 | 1033 | 237.2 |
| C | 14 | 254 | 1586084 | 6681.75 | 1041 | 1033 | 237.2 |
| C | 15 | 214 | 871218 | 3668.25 | 1041 | 1033 | 237.2 |
| D | 8 | 195 | 4130403 | 14923.88 | 1053 | 1021 | 276.7 |
| D | 13 | 249 | 749899 | 2706.5 | 1053 | 1021 | 276.7 |
| D | 7 | 223 | 580625 | 2094.73 | 1053 | 1021 | 276.7 |
Histogram calculated using DETX and DETY for each event in the final _common_clean file
| Quadrant A | 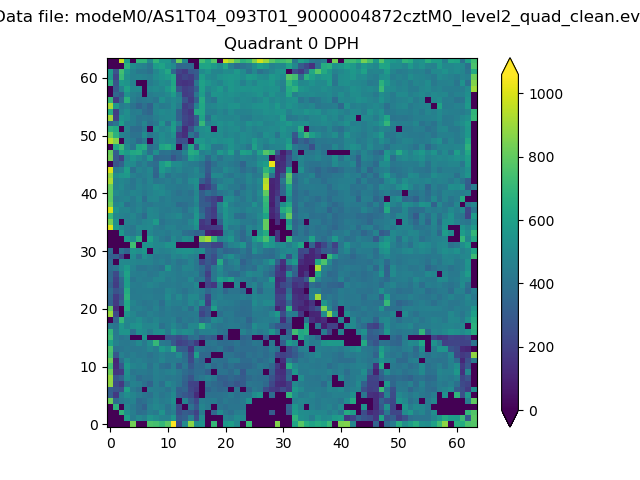 |
 |
Quadrant B |
|---|---|---|---|
| Quadrant D |  |
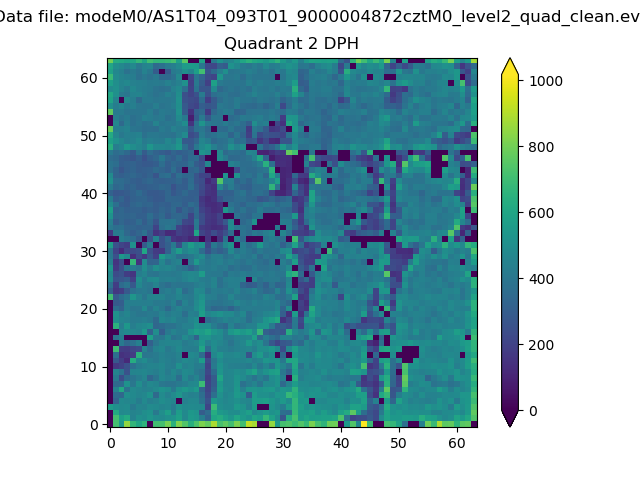 |
Quadrant C |
| Plot type | Count rate plots | Images |
|---|---|---|
| Comparison with Poisson distribution Blue bars denote a histogram of data divided into 1 sec bins. Red curve is a Poisson curve with rate = median count rate of data. |
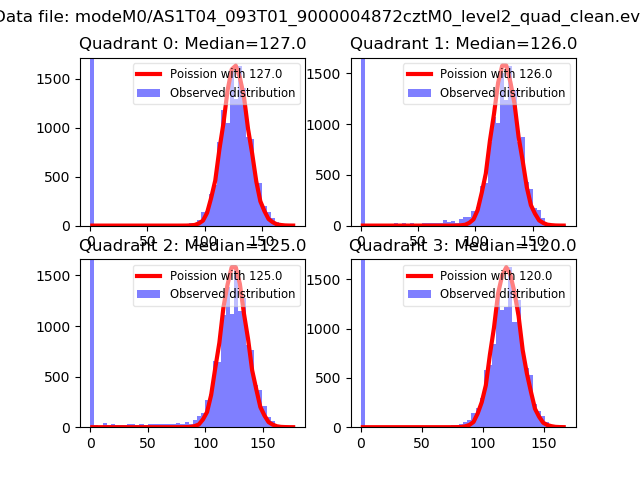 |
 |
| Quadrant-wise count rates Data is divided into 100 sec bins |
 |
|
| Module-wise count rates for Quadrant A Data is divided into 100 sec bins |
 |
 |
| Module-wise count rates for Quadrant B Data is divided into 100 sec bins |
 |
 |
| Module-wise count rates for Quadrant C Data is divided into 100 sec bins |
 |
 |
| Module-wise count rates for Quadrant D Data is divided into 100 sec bins |
 |
 |
| Parameter | Plot |
|---|---|
| CZT HV Monitor |  |
| D_VDD |  |
| Temperature 1 |  |
| Veto HV Monitor | 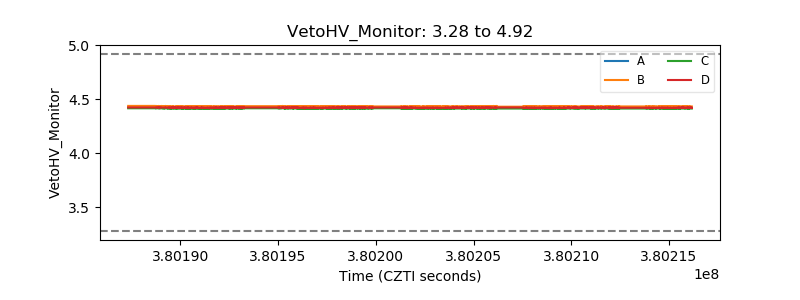 |
| Veto LLD |  |
| Alpha Counter |  |
| _CPM_Rate |  |
| CZT Counter |  |
| +2.5 Volts monitor |  |
| +5 Volts monitor |  |
| _ROLL_ROT |  |
| _Roll_DEC |  |
| _Roll_RA |  |
| Veto Counter |  |