| Param | Original file | Final file |
|---|---|---|
| Filename | modeM0/AS1A11_097T08_9000004874cztM0_level2_bc.evt | modeM0/AS1A11_097T08_9000004874cztM0_level2_quad_clean.evt |
| Size (bytes) | 4,496,192,640 | 1,204,392,960 |
| Size | 4.2 GB | 1.1 GB |
| Events in quadrant A | 20,057,146 | 7,644,901 |
| Events in quadrant B | 30,489,295 | 7,753,423 |
| Events in quadrant C | 32,338,868 | 7,499,000 |
| Events in quadrant D | 46,816,553 | 7,060,520 |
| Mode M9 | |||
|---|---|---|---|
| Quadrant | BADHDUFLAG | Total packets | Discarded packets |
| A | 0 | 398 | 0 |
| B | 0 | 398 | 0 |
| C | 0 | 398 | 0 |
| D | 0 | 398 | 0 |
| Mode M0 | |||
|---|---|---|---|
| Quadrant | BADHDUFLAG | Total packets | Discarded packets |
| A | 0 | 192725 | 0 |
| B | 0 | 234992 | 0 |
| C | 0 | 230662 | 0 |
| D | 0 | 288218 | 0 |
| Mode SS | |||
|---|---|---|---|
| Quadrant | BADHDUFLAG | Total packets | Discarded packets |
| A | 0 | 1942 | 0 |
| B | 0 | 1942 | 0 |
| C | 0 | 1942 | 0 |
| D | 0 | 1942 | 0 |
| Quadrant | Total seconds | Saturated seconds | Saturation percentage |
|---|---|---|---|
| A | 95177 | 112 | 0.117675% |
| B | 95177 | 3267 | 3.432552% |
| C | 95177 | 1896 | 1.992078% |
| D | 95177 | 4500 | 4.728033% |
Noise dominated data is calculated using 1-second bins in cleaned event files. If a bin has >2000 counts, and if more than 50% of those come from <1% of pixels, then it is considered to be noise-dominated and hence unusable.
| Quadrant | # 1 sec bins | Bins with >0 counts | Bins with >2000 counts | High rate bins dominated by noise | Noise dominated (total time) | Noise dominated (detector-on time) | Marked lightcurve |
|---|---|---|---|---|---|---|---|
| A | 151085 | 95193 | 3 | 3 | 0.00% | 0.00% |  |
| B | 151085 | 95180 | 198 | 198 | 0.13% | 0.21% |  |
| C | 151085 | 95181 | 244 | 244 | 0.16% | 0.26% |  |
| D | 151085 | 95182 | 932 | 932 | 0.62% | 0.98% |  |
Top three noisy pixels from each quadrant. If the there are fewer than three noisy pixels in the level2.evt file, extra rows are filled as -1
| Pixel properties | Quadrant properties | ||||||
|---|---|---|---|---|---|---|---|
| Quadrant | DetID | PixID | Counts | Sigma | Mean | Median | Sigma |
| A | 10 | 83 | 229908 | 205.25 | 5014 | 4942 | 1096.1 |
| A | 13 | 6 | 218604 | 194.93 | 5014 | 4942 | 1096.1 |
| A | 15 | 169 | 190049 | 168.88 | 5014 | 4942 | 1096.1 |
| B | 5 | 172 | 3511258 | 3571.71 | 5016 | 4915 | 981.7 |
| B | 5 | 31 | 2765658 | 2812.21 | 5016 | 4915 | 981.7 |
| B | 5 | 15 | 1257350 | 1275.78 | 5016 | 4915 | 981.7 |
| C | 0 | 10 | 7750900 | 7082.62 | 4848 | 4812 | 1093.7 |
| C | 15 | 214 | 3891668 | 3553.94 | 4848 | 4812 | 1093.7 |
| C | 14 | 254 | 765804 | 695.81 | 4848 | 4812 | 1093.7 |
| D | 8 | 195 | 11363170 | 9422.93 | 4809 | 4660 | 1205.4 |
| D | 2 | 250 | 2924422 | 2422.21 | 4809 | 4660 | 1205.4 |
| D | 10 | 118 | 2781189 | 2303.39 | 4809 | 4660 | 1205.4 |
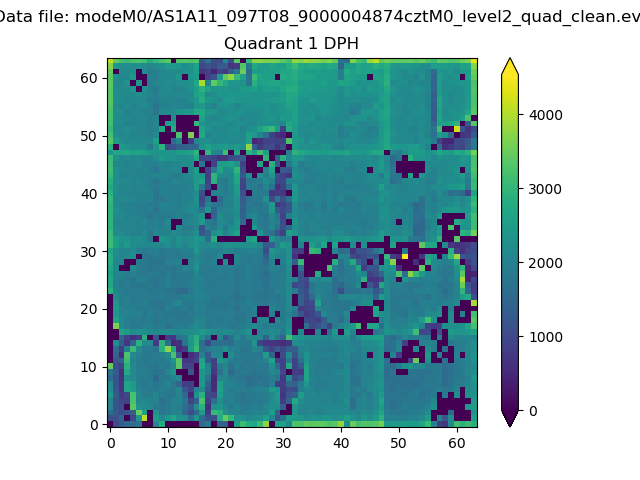
Histogram calculated using DETX and DETY for each event in the final _common_clean file
| Quadrant A |  |
 |
Quadrant B |
|---|---|---|---|
| Quadrant D |  |
 |
Quadrant C |
| Plot type | Count rate plots | Images |
|---|---|---|
| Comparison with Poisson distribution Blue bars denote a histogram of data divided into 1 sec bins. Red curve is a Poisson curve with rate = median count rate of data. |
 |
 |
| Quadrant-wise count rates Data is divided into 100 sec bins |
 |
|
| Module-wise count rates for Quadrant A Data is divided into 100 sec bins |
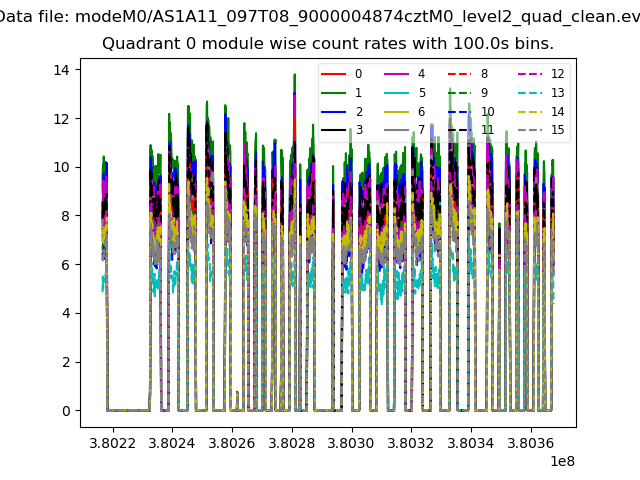 |
 |
| Module-wise count rates for Quadrant B Data is divided into 100 sec bins |
 |
 |
| Module-wise count rates for Quadrant C Data is divided into 100 sec bins |
 |
 |
| Module-wise count rates for Quadrant D Data is divided into 100 sec bins |
 |
 |
| Parameter | Plot |
|---|---|
| CZT HV Monitor |  |
| D_VDD | 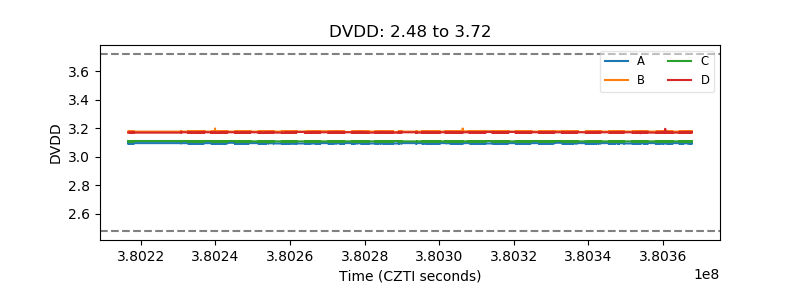 |
| Temperature 1 |  |
| Veto HV Monitor |  |
| Veto LLD | 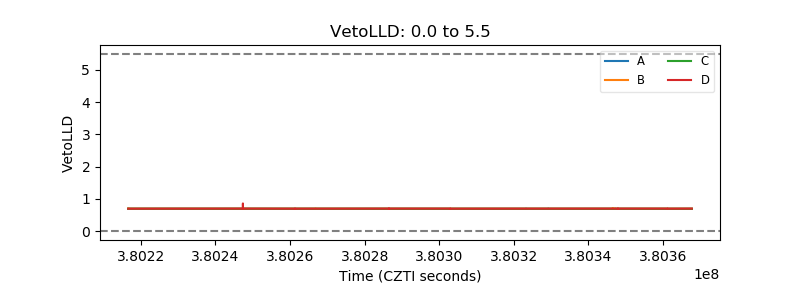 |
| Alpha Counter |  |
| _CPM_Rate |  |
| CZT Counter |  |
| +2.5 Volts monitor |  |
| +5 Volts monitor |  |
| _ROLL_ROT |  |
| _Roll_DEC |  |
| _Roll_RA |  |
| Veto Counter |  |