| Param | Original file | Final file |
|---|---|---|
| Filename | modeM0/AS1A05_208T01_9000004870cztM0_level2_bc.evt | modeM0/AS1A05_208T01_9000004870cztM0_level2_quad_clean.evt |
| Size (bytes) | 5,645,327,040 | 1,273,976,640 |
| Size | 5.3 GB | 1.2 GB |
| Events in quadrant A | 22,042,571 | 8,189,534 |
| Events in quadrant B | 42,869,393 | 8,110,415 |
| Events in quadrant C | 34,606,077 | 8,063,466 |
| Events in quadrant D | 64,728,174 | 7,430,064 |
| Mode SS | |||
|---|---|---|---|
| Quadrant | BADHDUFLAG | Total packets | Discarded packets |
| A | 0 | 2022 | 0 |
| B | 0 | 2022 | 0 |
| C | 0 | 2022 | 0 |
| D | 0 | 2022 | 0 |
| Mode M9 | |||
|---|---|---|---|
| Quadrant | BADHDUFLAG | Total packets | Discarded packets |
| A | 0 | 383 | 0 |
| B | 0 | 383 | 0 |
| C | 0 | 383 | 0 |
| D | 0 | 383 | 0 |
| Mode M0 | |||
|---|---|---|---|
| Quadrant | BADHDUFLAG | Total packets | Discarded packets |
| A | 0 | 205539 | 0 |
| B | 0 | 286488 | 0 |
| C | 0 | 244226 | 0 |
| D | 0 | 351189 | 0 |
| Quadrant | Total seconds | Saturated seconds | Saturation percentage |
|---|---|---|---|
| A | 99123 | 753 | 0.759662% |
| B | 99123 | 6493 | 6.550447% |
| C | 99123 | 2193 | 2.212403% |
| D | 99123 | 8101 | 8.172674% |
Noise dominated data is calculated using 1-second bins in cleaned event files. If a bin has >2000 counts, and if more than 50% of those come from <1% of pixels, then it is considered to be noise-dominated and hence unusable.
| Quadrant | # 1 sec bins | Bins with >0 counts | Bins with >2000 counts | High rate bins dominated by noise | Noise dominated (total time) | Noise dominated (detector-on time) | Marked lightcurve |
|---|---|---|---|---|---|---|---|
| A | 143399 | 99135 | 75 | 75 | 0.05% | 0.08% |  |
| B | 143399 | 99121 | 184 | 184 | 0.13% | 0.19% |  |
| C | 143399 | 99123 | 327 | 327 | 0.23% | 0.33% | 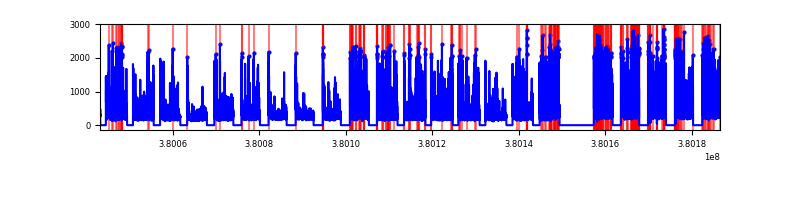 |
| D | 143399 | 99123 | 2354 | 2354 | 1.64% | 2.37% |  |
Top three noisy pixels from each quadrant. If the there are fewer than three noisy pixels in the level2.evt file, extra rows are filled as -1
| Pixel properties | Quadrant properties | ||||||
|---|---|---|---|---|---|---|---|
| Quadrant | DetID | PixID | Counts | Sigma | Mean | Median | Sigma |
| A | 15 | 17 | 1291682 | 1126.27 | 5238 | 5151 | 1142.3 |
| A | 10 | 83 | 221956 | 189.8 | 5238 | 5151 | 1142.3 |
| A | 13 | 6 | 182920 | 155.63 | 5238 | 5151 | 1142.3 |
| B | 5 | 172 | 11470428 | 11320.8 | 5167 | 5055 | 1012.8 |
| B | 5 | 31 | 6871990 | 6780.34 | 5167 | 5055 | 1012.8 |
| B | 5 | 15 | 1915510 | 1886.36 | 5167 | 5055 | 1012.8 |
| C | 0 | 10 | 6736996 | 5826.2 | 5108 | 5076 | 1155.5 |
| C | 15 | 214 | 4025195 | 3479.25 | 5108 | 5076 | 1155.5 |
| C | 14 | 254 | 1223580 | 1054.56 | 5108 | 5076 | 1155.5 |
| D | 8 | 195 | 17880933 | 14902.7 | 4993 | 4837 | 1199.5 |
| D | 7 | 223 | 8515058 | 7094.69 | 4993 | 4837 | 1199.5 |
| D | 2 | 250 | 4318850 | 3596.45 | 4993 | 4837 | 1199.5 |
Histogram calculated using DETX and DETY for each event in the final _common_clean file
| Quadrant A |  |
 |
Quadrant B |
|---|---|---|---|
| Quadrant D |  |
 |
Quadrant C |
| Plot type | Count rate plots | Images |
|---|---|---|
| Comparison with Poisson distribution Blue bars denote a histogram of data divided into 1 sec bins. Red curve is a Poisson curve with rate = median count rate of data. |
 |
 |
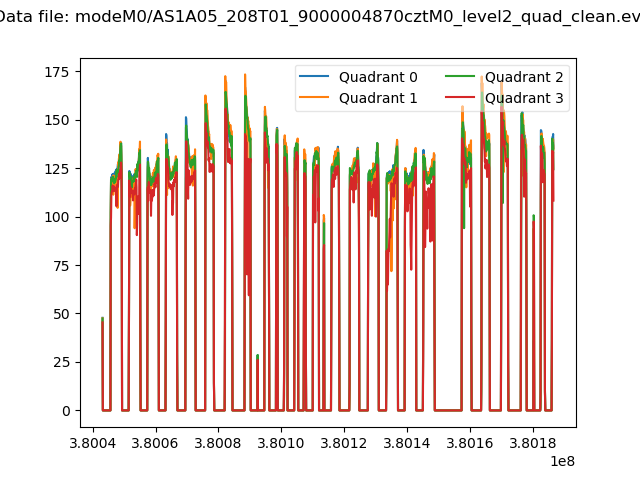
| Quadrant-wise count rates Data is divided into 100 sec bins |
 |
|
| Module-wise count rates for Quadrant A Data is divided into 100 sec bins |
 |
 |
| Module-wise count rates for Quadrant B Data is divided into 100 sec bins |
 |
 |
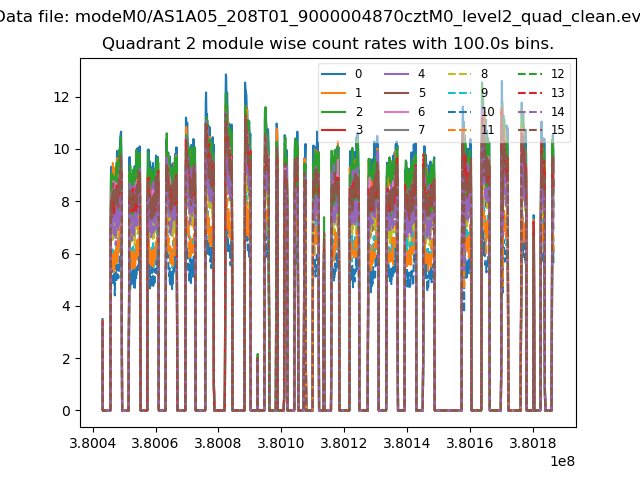
| Module-wise count rates for Quadrant C Data is divided into 100 sec bins |
 |
 |
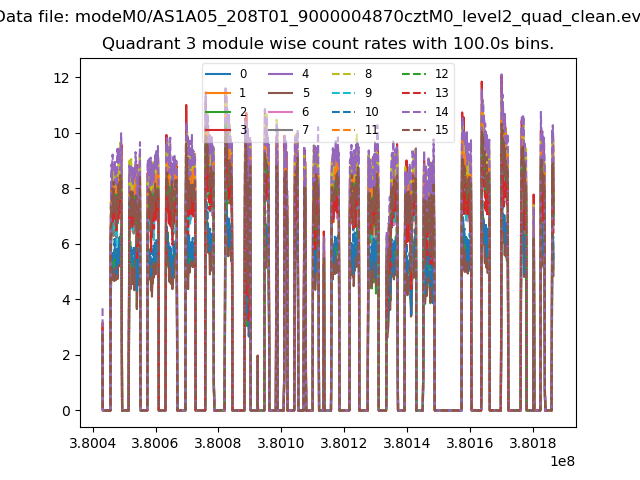
| Module-wise count rates for Quadrant D Data is divided into 100 sec bins |
 |
 |
| Parameter | Plot |
|---|---|
| CZT HV Monitor |  |
| D_VDD |  |
| Temperature 1 |  |
| Veto HV Monitor | 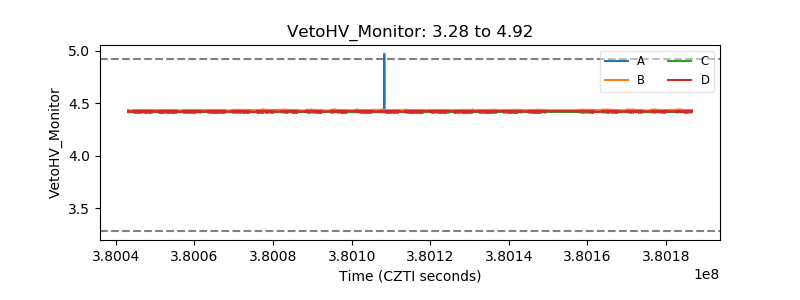 |
| Veto LLD |  |
| Alpha Counter |  |
| _CPM_Rate | 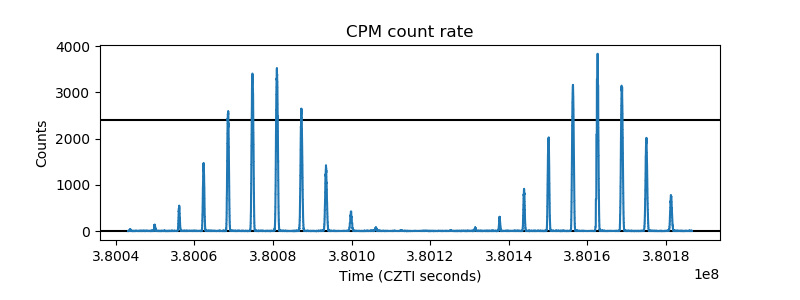 |
| CZT Counter | 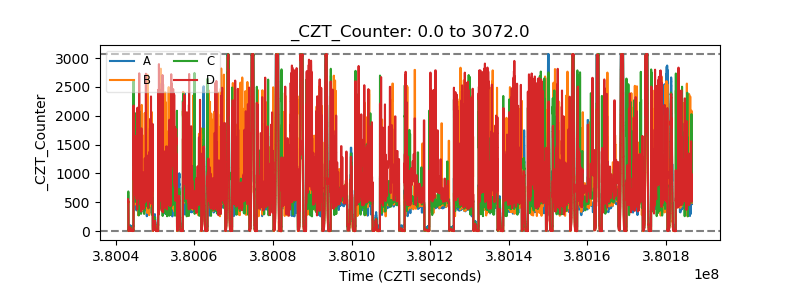 |
| +2.5 Volts monitor |  |
| +5 Volts monitor |  |
| _ROLL_ROT |  |
| _Roll_DEC |  |
| _Roll_RA |  |
| Veto Counter | 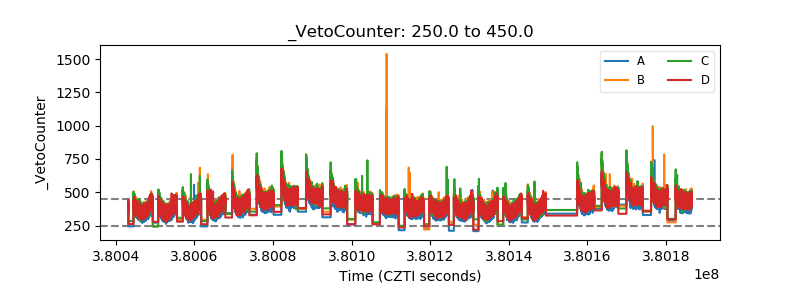 |