| Param | Original file | Final file |
|---|---|---|
| Filename | modeM0/AS1A06_003T04_9000004866cztM0_level2_bc.evt | modeM0/AS1A06_003T04_9000004866cztM0_level2_quad_clean.evt |
| Size (bytes) | 12,688,660,800 | 2,149,462,080 |
| Size | 11.8 GB | 2.0 GB |
| Events in quadrant A | 79,006,926 | 13,116,860 |
| Events in quadrant B | 125,468,980 | 12,724,825 |
| Events in quadrant C | 69,272,415 | 14,102,637 |
| Events in quadrant D | 98,555,228 | 13,042,246 |
| Mode M9 | |||
|---|---|---|---|
| Quadrant | BADHDUFLAG | Total packets | Discarded packets |
| A | 0 | 666 | 0 |
| B | 0 | 666 | 0 |
| C | 0 | 666 | 0 |
| D | 0 | 666 | 0 |
| Mode M0 | |||
|---|---|---|---|
| Quadrant | BADHDUFLAG | Total packets | Discarded packets |
| A | 0 | 588519 | 0 |
| B | 0 | 746241 | 0 |
| C | 0 | 464730 | 0 |
| D | 0 | 589835 | 0 |
| Mode SS | |||
|---|---|---|---|
| Quadrant | BADHDUFLAG | Total packets | Discarded packets |
| A | 0 | 3606 | 0 |
| B | 0 | 3604 | 0 |
| C | 0 | 3610 | 0 |
| D | 0 | 3608 | 0 |
| Quadrant | Total seconds | Saturated seconds | Saturation percentage |
|---|---|---|---|
| A | 176564 | 28542 | 16.165243% |
| B | 176485 | 48296 | 27.365498% |
| C | 176537 | 4135 | 2.342285% |
| D | 176433 | 16031 | 9.086169% |
Noise dominated data is calculated using 1-second bins in cleaned event files. If a bin has >2000 counts, and if more than 50% of those come from <1% of pixels, then it is considered to be noise-dominated and hence unusable.
| Quadrant | # 1 sec bins | Bins with >0 counts | Bins with >2000 counts | High rate bins dominated by noise | Noise dominated (total time) | Noise dominated (detector-on time) | Marked lightcurve |
|---|---|---|---|---|---|---|---|
| A | 244413 | 176653 | 236 | 236 | 0.10% | 0.13% |  |
| B | 244412 | 176567 | 4877 | 4877 | 2.00% | 2.76% |  |
| C | 244413 | 176623 | 709 | 709 | 0.29% | 0.40% | 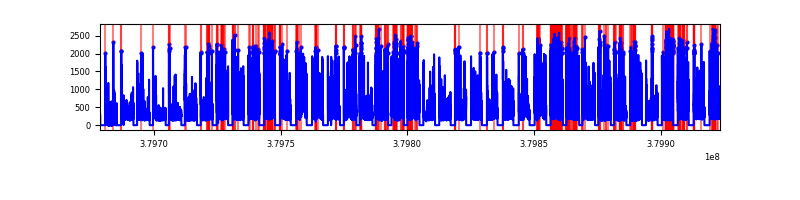 |
| D | 244413 | 176511 | 3351 | 3351 | 1.37% | 1.90% |  |
Top three noisy pixels from each quadrant. If the there are fewer than three noisy pixels in the level2.evt file, extra rows are filled as -1
| Pixel properties | Quadrant properties | ||||||
|---|---|---|---|---|---|---|---|
| Quadrant | DetID | PixID | Counts | Sigma | Mean | Median | Sigma |
| A | 15 | 169 | 44314119 | 23360.13 | 8719 | 8593 | 1896.6 |
| A | 10 | 83 | 345209 | 177.48 | 8719 | 8593 | 1896.6 |
| A | 13 | 6 | 323273 | 165.92 | 8719 | 8593 | 1896.6 |
| B | 5 | 31 | 46063216 | 27617.64 | 8521 | 8357 | 1667.6 |
| B | 5 | 15 | 21251421 | 12738.79 | 8521 | 8357 | 1667.6 |
| B | 5 | 172 | 14915431 | 8939.3 | 8521 | 8357 | 1667.6 |
| C | 3 | 233 | 9403207 | 4553.2 | 9139 | 9092 | 2063.2 |
| C | 0 | 10 | 9027814 | 4371.25 | 9139 | 9092 | 2063.2 |
| C | 15 | 214 | 7617476 | 3687.68 | 9139 | 9092 | 2063.2 |
| D | 8 | 195 | 19454191 | 8945.76 | 8989 | 8727 | 2173.7 |
| D | 2 | 249 | 9820913 | 4514.03 | 8989 | 8727 | 2173.7 |
| D | 8 | 230 | 6686959 | 3072.28 | 8989 | 8727 | 2173.7 |
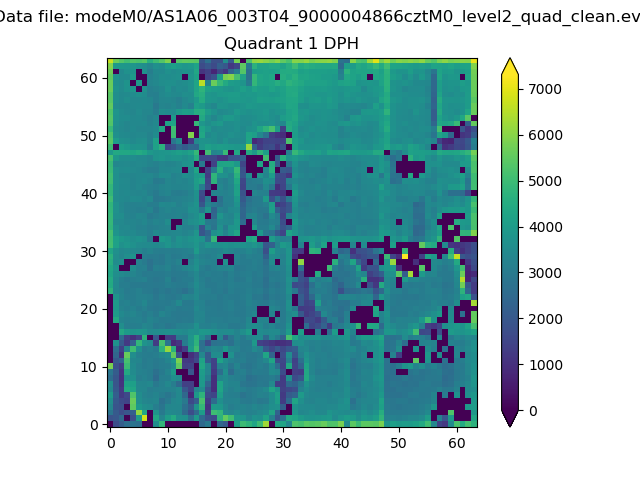
Histogram calculated using DETX and DETY for each event in the final _common_clean file
| Quadrant A |  |
 |
Quadrant B |
|---|---|---|---|
| Quadrant D |  |
 |
Quadrant C |
| Plot type | Count rate plots | Images |
|---|---|---|
| Comparison with Poisson distribution Blue bars denote a histogram of data divided into 1 sec bins. Red curve is a Poisson curve with rate = median count rate of data. |
 |
 |
| Quadrant-wise count rates Data is divided into 100 sec bins |
 |
|
| Module-wise count rates for Quadrant A Data is divided into 100 sec bins |
 |
 |
| Module-wise count rates for Quadrant B Data is divided into 100 sec bins |
 |
 |
| Module-wise count rates for Quadrant C Data is divided into 100 sec bins |
 |
 |
| Module-wise count rates for Quadrant D Data is divided into 100 sec bins |
 |
 |
| Parameter | Plot |
|---|---|
| CZT HV Monitor |  |
| D_VDD |  |
| Temperature 1 | 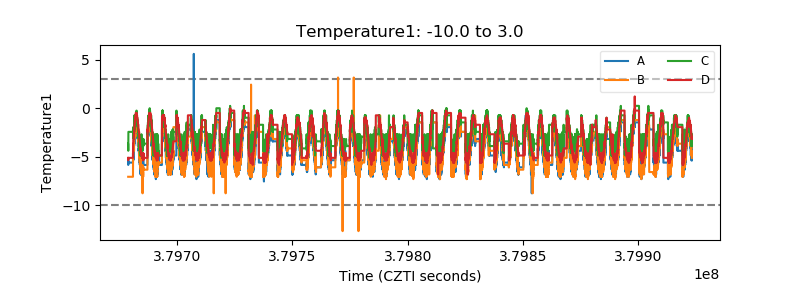 |
| Veto HV Monitor |  |
| Veto LLD | 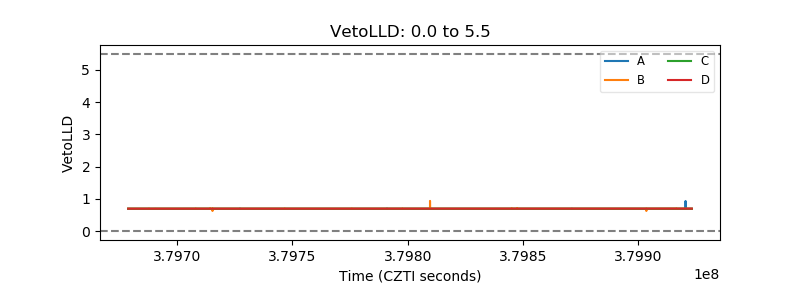 |
| Alpha Counter |  |
| _CPM_Rate |  |
| CZT Counter |  |
| +2.5 Volts monitor |  |
| +5 Volts monitor | 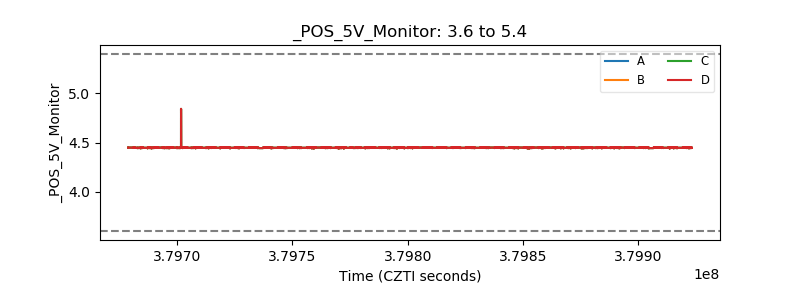 |
| _ROLL_ROT |  |
| _Roll_DEC |  |
| _Roll_RA |  |
| Veto Counter |  |