| Param | Original file | Final file |
|---|---|---|
| Filename | modeM0/AS1A11_106T03_9000004864cztM0_level2_bc.evt | modeM0/AS1A11_106T03_9000004864cztM0_level2_quad_clean.evt |
| Size (bytes) | 6,193,805,760 | 1,581,168,960 |
| Size | 5.8 GB | 1.5 GB |
| Events in quadrant A | 27,233,026 | 10,276,055 |
| Events in quadrant B | 37,737,563 | 10,214,025 |
| Events in quadrant C | 41,870,653 | 10,045,652 |
| Events in quadrant D | 72,824,835 | 9,365,184 |
| Mode M9 | |||
|---|---|---|---|
| Quadrant | BADHDUFLAG | Total packets | Discarded packets |
| A | 0 | 428 | 0 |
| B | 0 | 427 | 0 |
| C | 0 | 427 | 0 |
| D | 0 | 429 | 0 |
| Mode M0 | |||
|---|---|---|---|
| Quadrant | BADHDUFLAG | Total packets | Discarded packets |
| A | 0 | 246257 | 0 |
| B | 0 | 298334 | 0 |
| C | 0 | 289333 | 0 |
| D | 0 | 405203 | 0 |
| Mode SS | |||
|---|---|---|---|
| Quadrant | BADHDUFLAG | Total packets | Discarded packets |
| A | 0 | 2382 | 0 |
| B | 0 | 2390 | 0 |
| C | 0 | 2386 | 0 |
| D | 0 | 2382 | 0 |
| Quadrant | Total seconds | Saturated seconds | Saturation percentage |
|---|---|---|---|
| A | 116665 | 846 | 0.725153% |
| B | 116770 | 4521 | 3.871714% |
| C | 116651 | 2686 | 2.302595% |
| D | 116279 | 8861 | 7.620465% |
Noise dominated data is calculated using 1-second bins in cleaned event files. If a bin has >2000 counts, and if more than 50% of those come from <1% of pixels, then it is considered to be noise-dominated and hence unusable.
| Quadrant | # 1 sec bins | Bins with >0 counts | Bins with >2000 counts | High rate bins dominated by noise | Noise dominated (total time) | Noise dominated (detector-on time) | Marked lightcurve |
|---|---|---|---|---|---|---|---|
| A | 166119 | 117048 | 8 | 8 | 0.00% | 0.01% |  |
| B | 166118 | 117154 | 134 | 134 | 0.08% | 0.11% |  |
| C | 166118 | 117011 | 332 | 332 | 0.20% | 0.28% |  |
| D | 166118 | 116705 | 2051 | 2051 | 1.23% | 1.76% | 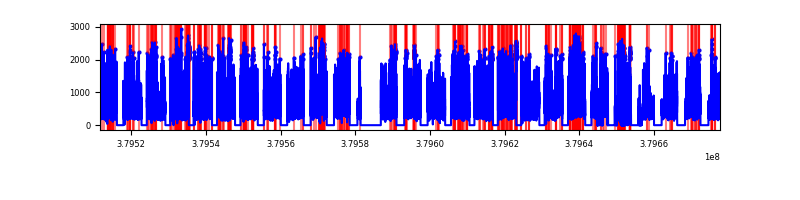 |
Top three noisy pixels from each quadrant. If the there are fewer than three noisy pixels in the level2.evt file, extra rows are filled as -1
| Pixel properties | Quadrant properties | ||||||
|---|---|---|---|---|---|---|---|
| Quadrant | DetID | PixID | Counts | Sigma | Mean | Median | Sigma |
| A | 15 | 169 | 1611863 | 1176.71 | 6203 | 6115 | 1364.6 |
| A | 14 | 238 | 914782 | 665.88 | 6203 | 6115 | 1364.6 |
| A | 13 | 6 | 325780 | 234.25 | 6203 | 6115 | 1364.6 |
| B | 5 | 172 | 7428949 | 6188.8 | 6125 | 5999 | 1199.4 |
| B | 0 | 189 | 1191026 | 988.0 | 6125 | 5999 | 1199.4 |
| B | 0 | 190 | 1190680 | 987.71 | 6125 | 5999 | 1199.4 |
| C | 4 | 254 | 5436613 | 4047.5 | 5941 | 5913 | 1341.7 |
| C | 15 | 214 | 4849400 | 3609.85 | 5941 | 5913 | 1341.7 |
| C | 3 | 233 | 4121057 | 3067.02 | 5941 | 5913 | 1341.7 |
| D | 8 | 195 | 24231153 | 15815.15 | 5809 | 5681 | 1531.8 |
| D | 8 | 230 | 4630800 | 3019.42 | 5809 | 5681 | 1531.8 |
| D | 12 | 6 | 4523262 | 2949.22 | 5809 | 5681 | 1531.8 |
Histogram calculated using DETX and DETY for each event in the final _common_clean file
| Quadrant A |  |
 |
Quadrant B |
|---|---|---|---|
| Quadrant D |  |
 |
Quadrant C |
| Plot type | Count rate plots | Images |
|---|---|---|
| Comparison with Poisson distribution Blue bars denote a histogram of data divided into 1 sec bins. Red curve is a Poisson curve with rate = median count rate of data. |
 |
 |
| Quadrant-wise count rates Data is divided into 100 sec bins |
 |
|
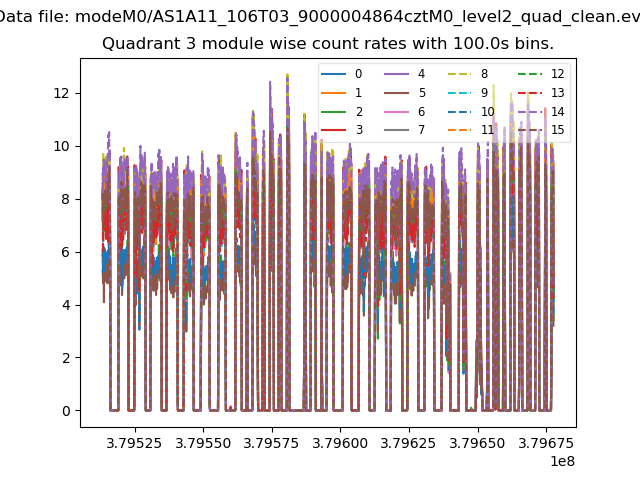
| Module-wise count rates for Quadrant A Data is divided into 100 sec bins |
 |
 |
| Module-wise count rates for Quadrant B Data is divided into 100 sec bins |
 |
 |
| Module-wise count rates for Quadrant C Data is divided into 100 sec bins |
 |
 |
| Module-wise count rates for Quadrant D Data is divided into 100 sec bins |
 |
 |
| Parameter | Plot |
|---|---|
| CZT HV Monitor |  |
| D_VDD |  |
| Temperature 1 |  |
| Veto HV Monitor |  |
| Veto LLD |  |
| Alpha Counter |  |
| _CPM_Rate | 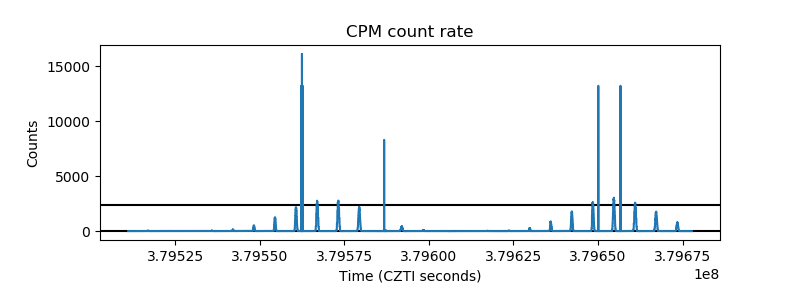 |
| CZT Counter |  |
| +2.5 Volts monitor |  |
| +5 Volts monitor |  |
| _ROLL_ROT |  |
| _Roll_DEC |  |
| _Roll_RA | 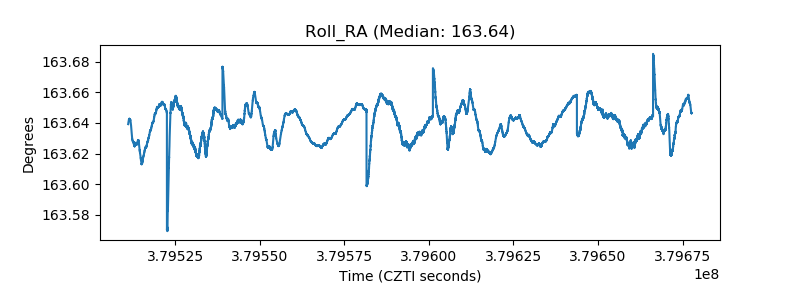 |
| Veto Counter |  |