| Param | Original file | Final file |
|---|---|---|
| Filename | modeM0/AS1A11_046T07_9000004862cztM0_level2_bc.evt | modeM0/AS1A11_046T07_9000004862cztM0_level2_quad_clean.evt |
| Size (bytes) | 3,070,160,640 | 671,100,480 |
| Size | 2.9 GB | 640.0 MB |
| Events in quadrant A | 16,835,768 | 4,073,466 |
| Events in quadrant B | 18,009,597 | 4,238,648 |
| Events in quadrant C | 20,787,286 | 4,233,055 |
| Events in quadrant D | 33,566,196 | 3,966,512 |
| Mode M9 | |||
|---|---|---|---|
| Quadrant | BADHDUFLAG | Total packets | Discarded packets |
| A | 0 | 202 | 0 |
| B | 0 | 202 | 0 |
| C | 0 | 202 | 0 |
| D | 0 | 202 | 0 |
| Mode M0 | |||
|---|---|---|---|
| Quadrant | BADHDUFLAG | Total packets | Discarded packets |
| A | 0 | 141935 | 0 |
| B | 0 | 173623 | 0 |
| C | 0 | 145837 | 0 |
| D | 0 | 190150 | 0 |
| Mode SS | |||
|---|---|---|---|
| Quadrant | BADHDUFLAG | Total packets | Discarded packets |
| A | 0 | 1134 | 0 |
| B | 0 | 1134 | 0 |
| C | 0 | 1134 | 0 |
| D | 0 | 1134 | 0 |
| Quadrant | Total seconds | Saturated seconds | Saturation percentage |
|---|---|---|---|
| A | 55568 | 4529 | 8.150374% |
| B | 55568 | 6809 | 12.253455% |
| C | 55568 | 2118 | 3.811546% |
| D | 55568 | 3814 | 6.863663% |
Noise dominated data is calculated using 1-second bins in cleaned event files. If a bin has >2000 counts, and if more than 50% of those come from <1% of pixels, then it is considered to be noise-dominated and hence unusable.
| Quadrant | # 1 sec bins | Bins with >0 counts | Bins with >2000 counts | High rate bins dominated by noise | Noise dominated (total time) | Noise dominated (detector-on time) | Marked lightcurve |
|---|---|---|---|---|---|---|---|
| A | 75635 | 54717 | 10 | 10 | 0.01% | 0.02% |  |
| B | 75636 | 55568 | 99 | 99 | 0.13% | 0.18% |  |
| C | 75636 | 55568 | 357 | 357 | 0.47% | 0.64% |  |
| D | 75636 | 55569 | 969 | 969 | 1.28% | 1.74% |  |
Top three noisy pixels from each quadrant. If the there are fewer than three noisy pixels in the level2.evt file, extra rows are filled as -1
| Pixel properties | Quadrant properties | ||||||
|---|---|---|---|---|---|---|---|
| Quadrant | DetID | PixID | Counts | Sigma | Mean | Median | Sigma |
| A | 15 | 169 | 5467156 | 8761.21 | 2870 | 2827 | 623.7 |
| A | 13 | 6 | 112084 | 175.18 | 2870 | 2827 | 623.7 |
| A | 13 | 254 | 89967 | 139.72 | 2870 | 2827 | 623.7 |
| B | 5 | 172 | 4063005 | 7196.62 | 2883 | 2829 | 564.2 |
| B | 0 | 190 | 1105744 | 1954.9 | 2883 | 2829 | 564.2 |
| B | 4 | 232 | 241457 | 422.96 | 2883 | 2829 | 564.2 |
| C | 9 | 187 | 2346283 | 3598.22 | 2912 | 2896 | 651.3 |
| C | 4 | 254 | 2323877 | 3563.81 | 2912 | 2896 | 651.3 |
| C | 15 | 214 | 2232858 | 3424.06 | 2912 | 2896 | 651.3 |
| D | 8 | 195 | 11913598 | 17525.75 | 2882 | 2799 | 679.6 |
| D | 8 | 230 | 2441761 | 3588.73 | 2882 | 2799 | 679.6 |
| D | 12 | 6 | 2075814 | 3050.27 | 2882 | 2799 | 679.6 |
Histogram calculated using DETX and DETY for each event in the final _common_clean file
| Quadrant A | 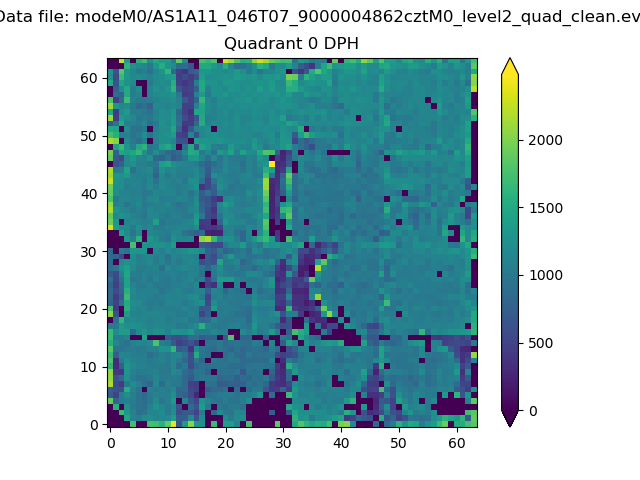 |
 |
Quadrant B |
|---|---|---|---|
| Quadrant D |  |
 |
Quadrant C |
| Plot type | Count rate plots | Images |
|---|---|---|
| Comparison with Poisson distribution Blue bars denote a histogram of data divided into 1 sec bins. Red curve is a Poisson curve with rate = median count rate of data. |
 |
 |
| Quadrant-wise count rates Data is divided into 100 sec bins |
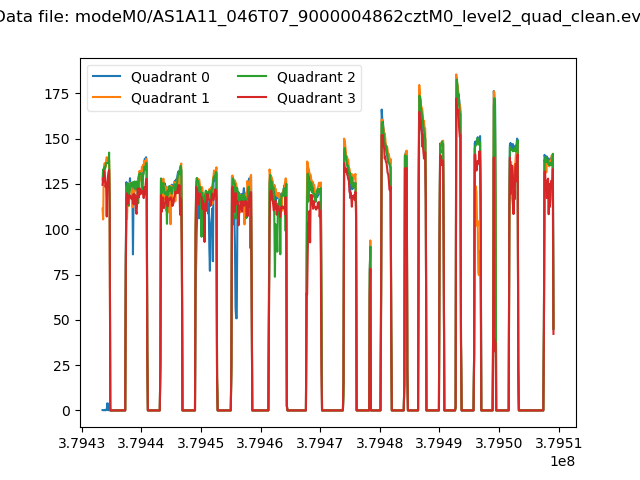 |
|
| Module-wise count rates for Quadrant A Data is divided into 100 sec bins |
 |
 |
| Module-wise count rates for Quadrant B Data is divided into 100 sec bins |
 |
 |
| Module-wise count rates for Quadrant C Data is divided into 100 sec bins |
 |
 |
| Module-wise count rates for Quadrant D Data is divided into 100 sec bins |
 |
 |
| Parameter | Plot |
|---|---|
| CZT HV Monitor | 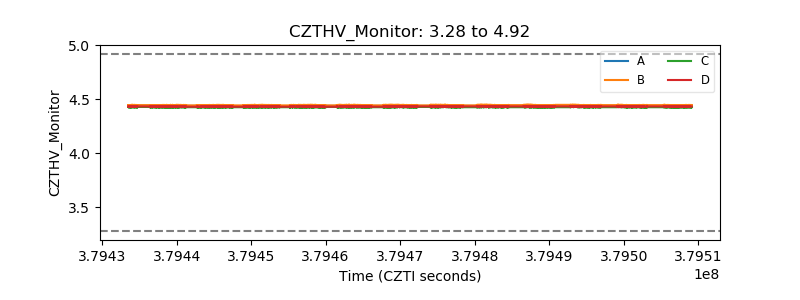 |
| D_VDD |  |
| Temperature 1 |  |
| Veto HV Monitor |  |
| Veto LLD | 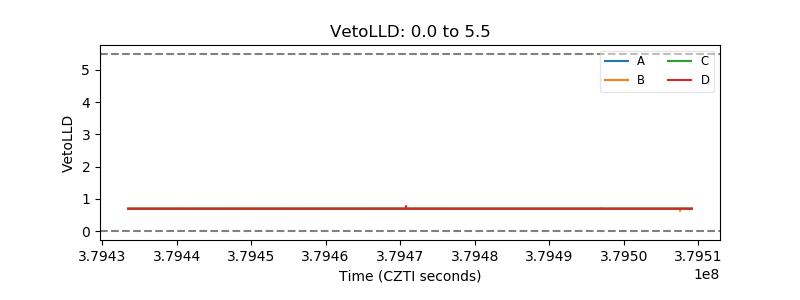 |
| Alpha Counter |  |
| _CPM_Rate |  |
| CZT Counter |  |
| +2.5 Volts monitor | 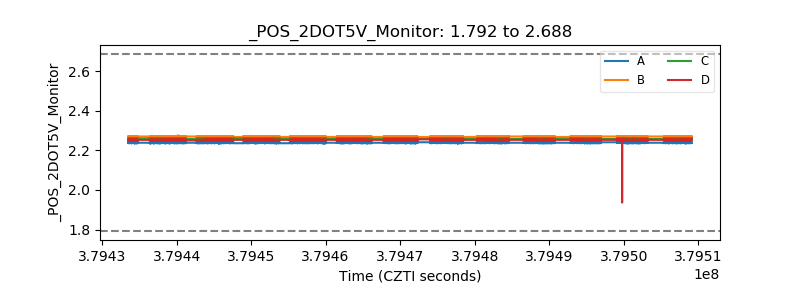 |
| +5 Volts monitor | 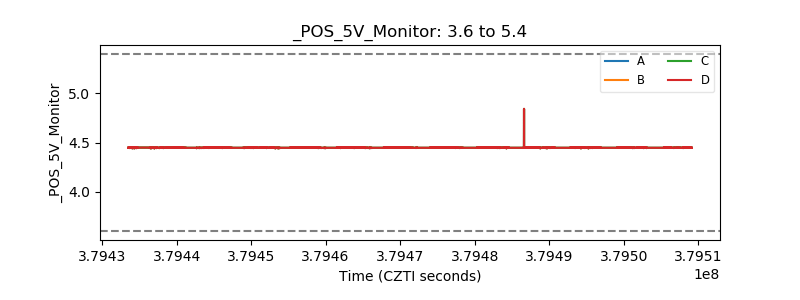 |
| _ROLL_ROT | 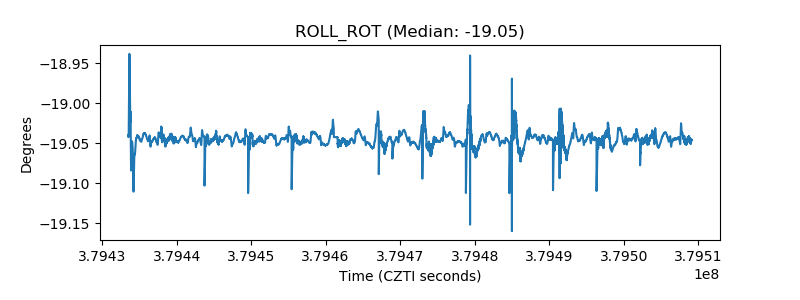 |
| _Roll_DEC | 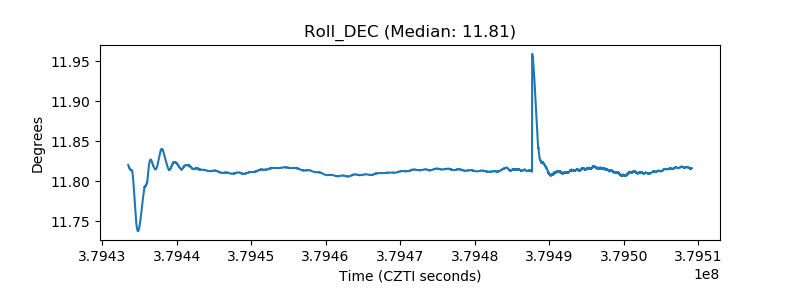 |
| _Roll_RA |  |
| Veto Counter |  |