| Param | Original file | Final file |
|---|---|---|
| Filename | modeM0/AS1A11_058T01_9000004854cztM0_level2_bc.evt | modeM0/AS1A11_058T01_9000004854cztM0_level2_quad_clean.evt |
| Size (bytes) | 1,312,704,000 | 472,849,920 |
| Size | 1.2 GB | 450.9 MB |
| Events in quadrant A | 7,569,555 | 3,351,816 |
| Events in quadrant B | 8,214,337 | 3,305,827 |
| Events in quadrant C | 7,084,381 | 3,182,724 |
| Events in quadrant D | 15,304,172 | 2,883,417 |
| Mode SS | |||
|---|---|---|---|
| Quadrant | BADHDUFLAG | Total packets | Discarded packets |
| A | 0 | 476 | 0 |
| B | 0 | 476 | 0 |
| C | 0 | 476 | 0 |
| D | 0 | 476 | 0 |
| Mode M9 | |||
|---|---|---|---|
| Quadrant | BADHDUFLAG | Total packets | Discarded packets |
| A | 0 | 115 | 0 |
| B | 0 | 115 | 0 |
| C | 0 | 115 | 0 |
| D | 0 | 115 | 0 |
| Mode M0 | |||
|---|---|---|---|
| Quadrant | BADHDUFLAG | Total packets | Discarded packets |
| A | 0 | 54494 | 0 |
| B | 0 | 58598 | 0 |
| C | 0 | 51302 | 0 |
| D | 0 | 86943 | 0 |
| Quadrant | Total seconds | Saturated seconds | Saturation percentage |
|---|---|---|---|
| A | 23229 | 173 | 0.744759% |
| B | 23229 | 791 | 3.405226% |
| C | 23229 | 233 | 1.003057% |
| D | 23229 | 2946 | 12.682423% |
Noise dominated data is calculated using 1-second bins in cleaned event files. If a bin has >2000 counts, and if more than 50% of those come from <1% of pixels, then it is considered to be noise-dominated and hence unusable.
| Quadrant | # 1 sec bins | Bins with >0 counts | Bins with >2000 counts | High rate bins dominated by noise | Noise dominated (total time) | Noise dominated (detector-on time) | Marked lightcurve |
|---|---|---|---|---|---|---|---|
| A | 33389 | 23230 | 67 | 67 | 0.20% | 0.29% | 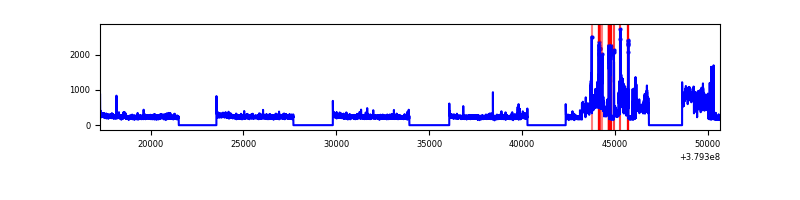 |
| B | 33389 | 23228 | 98 | 98 | 0.29% | 0.42% |  |
| C | 33389 | 23229 | 34 | 34 | 0.10% | 0.15% |  |
| D | 33389 | 23226 | 228 | 228 | 0.68% | 0.98% |  |
Top three noisy pixels from each quadrant. If the there are fewer than three noisy pixels in the level2.evt file, extra rows are filled as -1
| Pixel properties | Quadrant properties | ||||||
|---|---|---|---|---|---|---|---|
| Quadrant | DetID | PixID | Counts | Sigma | Mean | Median | Sigma |
| A | 15 | 169 | 2247076 | 7678.62 | 1343 | 1331 | 292.5 |
| A | 14 | 238 | 55416 | 184.93 | 1343 | 1331 | 292.5 |
| A | 10 | 83 | 45170 | 149.89 | 1343 | 1331 | 292.5 |
| B | 5 | 172 | 1933074 | 7434.12 | 1320 | 1298 | 259.9 |
| B | 3 | 112 | 349218 | 1338.91 | 1320 | 1298 | 259.9 |
| B | 0 | 229 | 205717 | 786.67 | 1320 | 1298 | 259.9 |
| C | 15 | 214 | 969459 | 3382.11 | 1261 | 1258 | 286.3 |
| C | 0 | 10 | 681645 | 2376.72 | 1261 | 1258 | 286.3 |
| C | 3 | 233 | 357977 | 1246.09 | 1261 | 1258 | 286.3 |
| D | 8 | 195 | 4005307 | 12641.02 | 1209 | 1185 | 316.8 |
| D | 7 | 238 | 1576373 | 4972.87 | 1209 | 1185 | 316.8 |
| D | 12 | 33 | 1324279 | 4177.01 | 1209 | 1185 | 316.8 |
Histogram calculated using DETX and DETY for each event in the final _common_clean file
| Quadrant A |  |
 |
Quadrant B |
|---|---|---|---|
| Quadrant D |  |
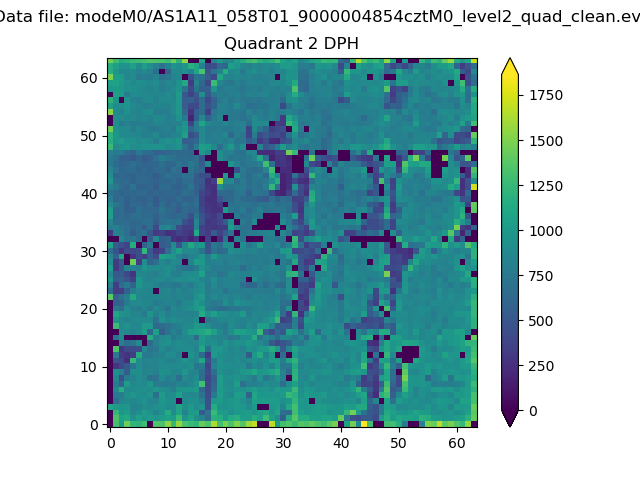 |
Quadrant C |
| Plot type | Count rate plots | Images |
|---|---|---|
| Comparison with Poisson distribution Blue bars denote a histogram of data divided into 1 sec bins. Red curve is a Poisson curve with rate = median count rate of data. |
 |
 |
| Quadrant-wise count rates Data is divided into 100 sec bins |
 |
|
| Module-wise count rates for Quadrant A Data is divided into 100 sec bins |
 |
 |
| Module-wise count rates for Quadrant B Data is divided into 100 sec bins |
 |
 |
| Module-wise count rates for Quadrant C Data is divided into 100 sec bins |
 |
 |
| Module-wise count rates for Quadrant D Data is divided into 100 sec bins |
 |
 |
| Parameter | Plot |
|---|---|
| CZT HV Monitor |  |
| D_VDD |  |
| Temperature 1 |  |
| Veto HV Monitor | 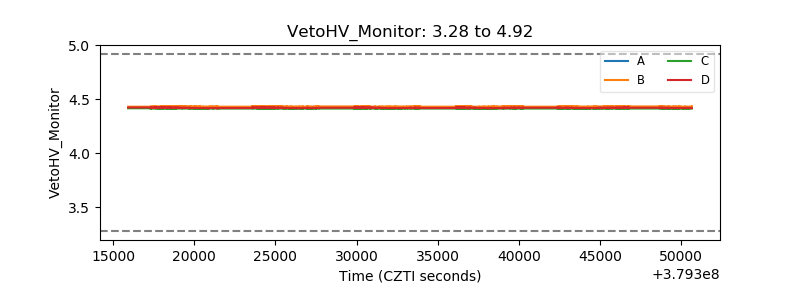 |
| Veto LLD |  |
| Alpha Counter |  |
| _CPM_Rate |  |
| CZT Counter |  |
| +2.5 Volts monitor |  |
| +5 Volts monitor |  |
| _ROLL_ROT |  |
| _Roll_DEC |  |
| _Roll_RA | 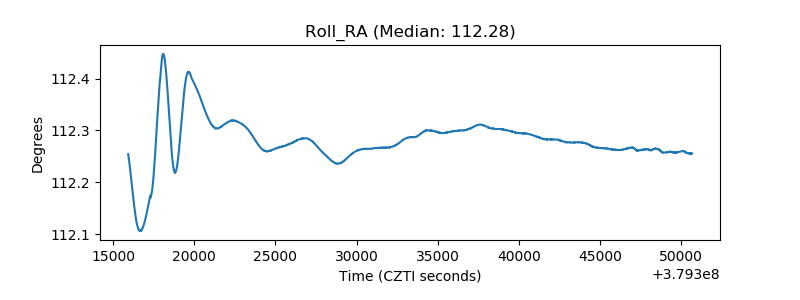 |
| Veto Counter | 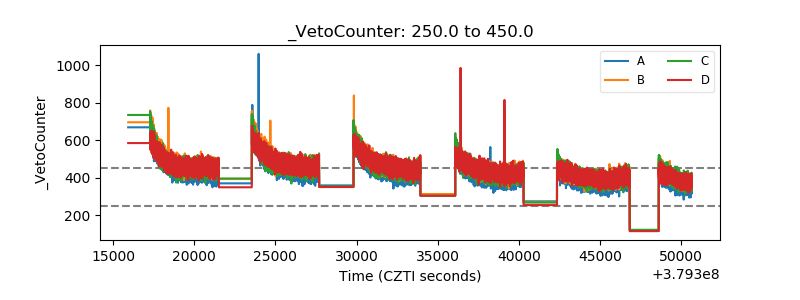 |