| Param | Original file | Final file |
|---|---|---|
| Filename | modeM0/AS1A11_034T02_9000004856cztM0_level2_bc.evt | modeM0/AS1A11_034T02_9000004856cztM0_level2_quad_clean.evt |
| Size (bytes) | 591,102,720 | 128,600,640 |
| Size | 563.7 MB | 122.6 MB |
| Events in quadrant A | 3,143,559 | 785,966 |
| Events in quadrant B | 3,519,245 | 786,058 |
| Events in quadrant C | 3,510,464 | 769,999 |
| Events in quadrant D | 6,900,721 | 717,460 |
| Mode M9 | |||
|---|---|---|---|
| Quadrant | BADHDUFLAG | Total packets | Discarded packets |
| A | 0 | 41 | 0 |
| B | 0 | 41 | 0 |
| C | 0 | 41 | 0 |
| D | 0 | 41 | 0 |
| Mode SS | |||
|---|---|---|---|
| Quadrant | BADHDUFLAG | Total packets | Discarded packets |
| A | 0 | 248 | 0 |
| B | 0 | 248 | 0 |
| C | 0 | 248 | 0 |
| D | 0 | 248 | 0 |
| Mode M0 | |||
|---|---|---|---|
| Quadrant | BADHDUFLAG | Total packets | Discarded packets |
| A | 0 | 26847 | 0 |
| B | 0 | 28414 | 0 |
| C | 0 | 27092 | 0 |
| D | 0 | 40990 | 0 |
| Quadrant | Total seconds | Saturated seconds | Saturation percentage |
|---|---|---|---|
| A | 12073 | 93 | 0.770314% |
| B | 12073 | 276 | 2.286093% |
| C | 12073 | 115 | 0.952539% |
| D | 12073 | 823 | 6.816864% |
Noise dominated data is calculated using 1-second bins in cleaned event files. If a bin has >2000 counts, and if more than 50% of those come from <1% of pixels, then it is considered to be noise-dominated and hence unusable.
| Quadrant | # 1 sec bins | Bins with >0 counts | Bins with >2000 counts | High rate bins dominated by noise | Noise dominated (total time) | Noise dominated (detector-on time) | Marked lightcurve |
|---|---|---|---|---|---|---|---|
| A | 16162 | 12075 | 0 | 0 | 0.00% | 0.00% |  |
| B | 16162 | 12073 | 11 | 11 | 0.07% | 0.09% |  |
| C | 16162 | 12073 | 7 | 7 | 0.04% | 0.06% | 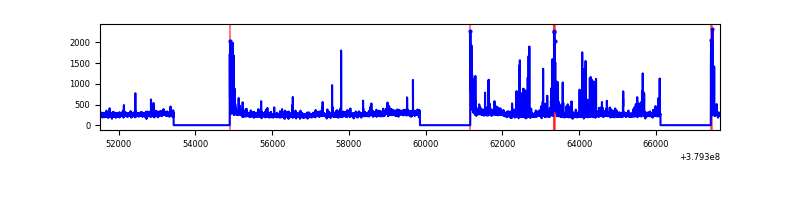 |
| D | 16162 | 12074 | 60 | 60 | 0.37% | 0.50% |  |
Top three noisy pixels from each quadrant. If the there are fewer than three noisy pixels in the level2.evt file, extra rows are filled as -1
| Pixel properties | Quadrant properties | ||||||
|---|---|---|---|---|---|---|---|
| Quadrant | DetID | PixID | Counts | Sigma | Mean | Median | Sigma |
| A | 15 | 169 | 694415 | 5050.95 | 611 | 602 | 137.4 |
| A | 13 | 6 | 35022 | 250.58 | 611 | 602 | 137.4 |
| A | 14 | 238 | 23769 | 168.66 | 611 | 602 | 137.4 |
| B | 5 | 172 | 713369 | 5766.62 | 611 | 598 | 123.6 |
| B | 4 | 251 | 174897 | 1410.15 | 611 | 598 | 123.6 |
| B | 0 | 190 | 86930 | 698.46 | 611 | 598 | 123.6 |
| C | 15 | 214 | 497675 | 3623.21 | 597 | 593 | 137.2 |
| C | 0 | 10 | 326682 | 2376.85 | 597 | 593 | 137.2 |
| C | 3 | 233 | 233648 | 1698.73 | 597 | 593 | 137.2 |
| D | 8 | 195 | 1713118 | 11778.37 | 586 | 565 | 145.4 |
| D | 2 | 250 | 681203 | 4681.2 | 586 | 565 | 145.4 |
| D | 7 | 238 | 545982 | 3751.19 | 586 | 565 | 145.4 |
Histogram calculated using DETX and DETY for each event in the final _common_clean file
| Quadrant A | 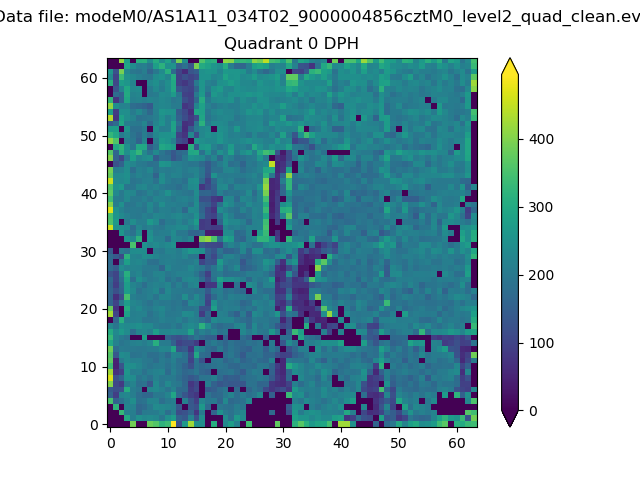 |
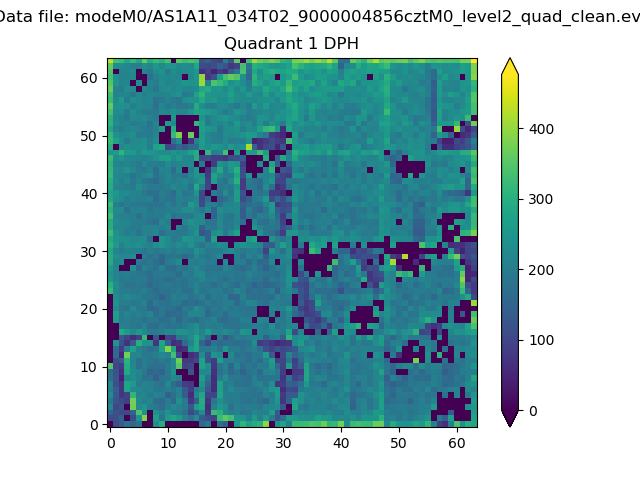 |
Quadrant B |
|---|---|---|---|
| Quadrant D |  |
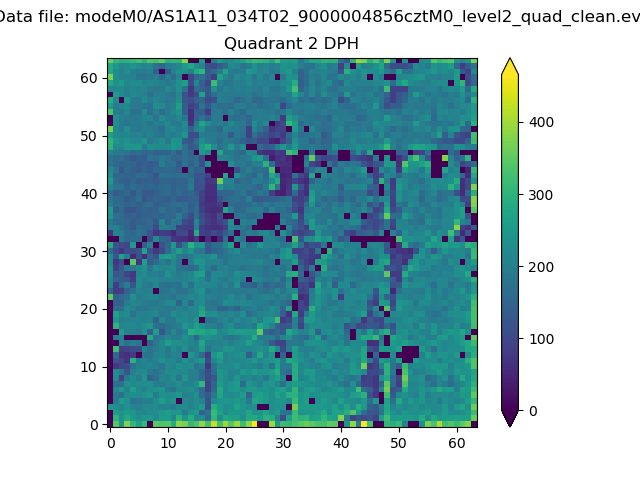 |
Quadrant C |
| Plot type | Count rate plots | Images |
|---|---|---|
| Comparison with Poisson distribution Blue bars denote a histogram of data divided into 1 sec bins. Red curve is a Poisson curve with rate = median count rate of data. |
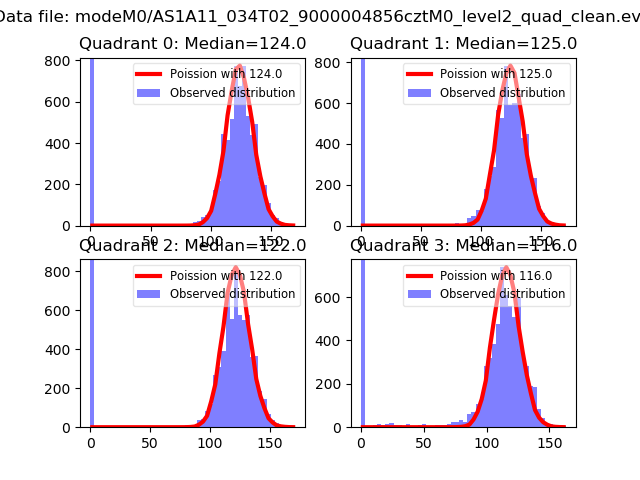 |
 |
| Quadrant-wise count rates Data is divided into 100 sec bins |
 |
|
| Module-wise count rates for Quadrant A Data is divided into 100 sec bins |
 |
 |
| Module-wise count rates for Quadrant B Data is divided into 100 sec bins |
 |
 |
| Module-wise count rates for Quadrant C Data is divided into 100 sec bins |
 |
 |
| Module-wise count rates for Quadrant D Data is divided into 100 sec bins |
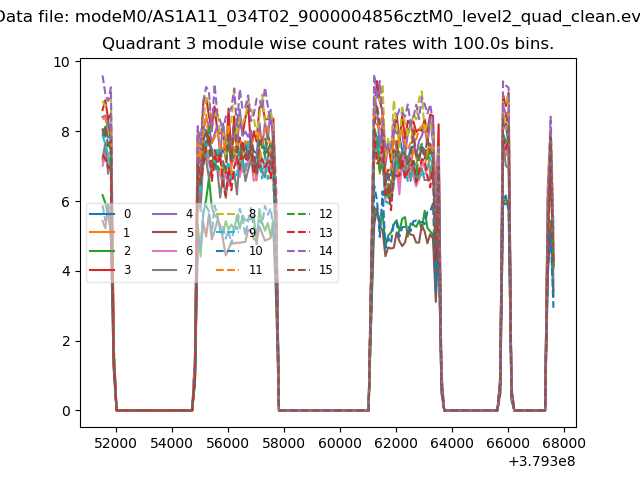 |
 |
| Parameter | Plot |
|---|---|
| CZT HV Monitor |  |
| D_VDD | 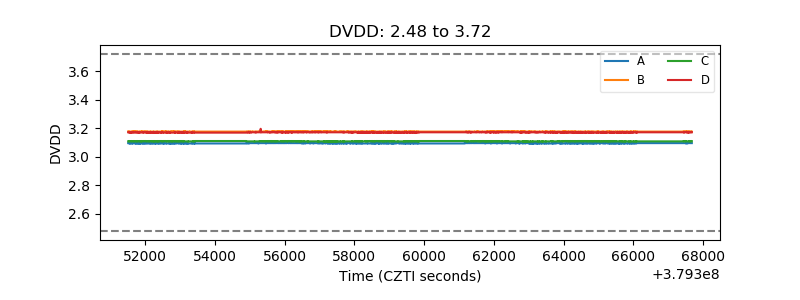 |
| Temperature 1 |  |
| Veto HV Monitor |  |
| Veto LLD |  |
| Alpha Counter | 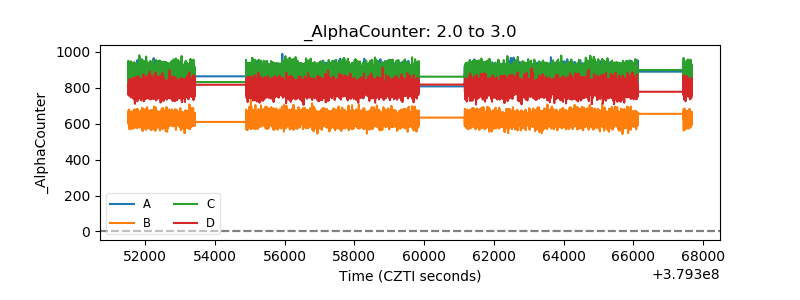 |
| _CPM_Rate |  |
| CZT Counter |  |
| +2.5 Volts monitor |  |
| +5 Volts monitor |  |
| _ROLL_ROT |  |
| _Roll_DEC |  |
| _Roll_RA | 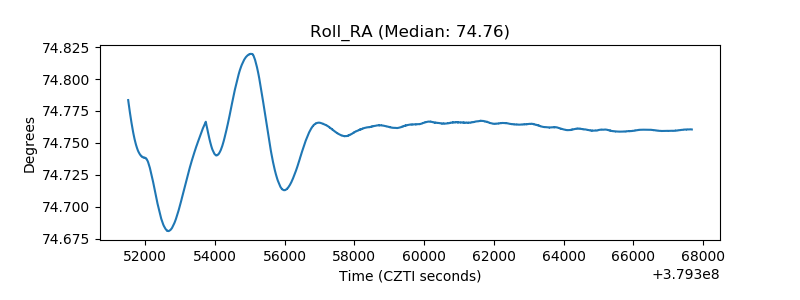 |
| Veto Counter | 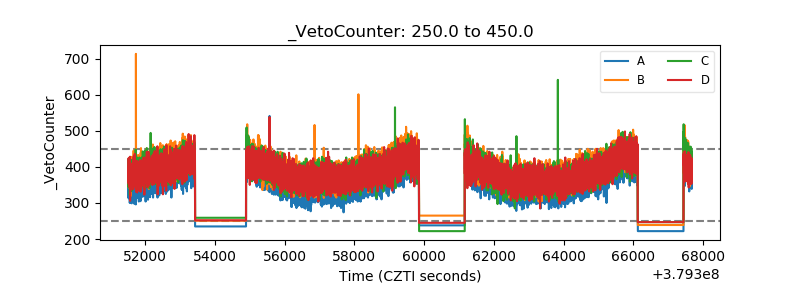 |