| Param | Original file | Final file |
|---|---|---|
| Filename | modeM0/AS1T04_074T01_9000004852cztM0_level2_bc.evt | modeM0/AS1T04_074T01_9000004852cztM0_level2_quad_clean.evt |
| Size (bytes) | 1,259,890,560 | 259,686,720 |
| Size | 1.2 GB | 247.7 MB |
| Events in quadrant A | 5,730,544 | 1,601,184 |
| Events in quadrant B | 7,513,174 | 1,585,038 |
| Events in quadrant C | 7,195,801 | 1,583,805 |
| Events in quadrant D | 16,057,982 | 1,420,677 |
| Mode SS | |||
|---|---|---|---|
| Quadrant | BADHDUFLAG | Total packets | Discarded packets |
| A | 0 | 496 | 0 |
| B | 0 | 496 | 0 |
| C | 0 | 496 | 0 |
| D | 0 | 496 | 0 |
| Mode M9 | |||
|---|---|---|---|
| Quadrant | BADHDUFLAG | Total packets | Discarded packets |
| A | 0 | 78 | 0 |
| B | 0 | 78 | 0 |
| C | 0 | 78 | 0 |
| D | 0 | 78 | 0 |
| Mode M0 | |||
|---|---|---|---|
| Quadrant | BADHDUFLAG | Total packets | Discarded packets |
| A | 0 | 53748 | 0 |
| B | 0 | 59863 | 0 |
| C | 0 | 54290 | 0 |
| D | 0 | 88521 | 0 |
| Quadrant | Total seconds | Saturated seconds | Saturation percentage |
|---|---|---|---|
| A | 24325 | 467 | 1.919836% |
| B | 24325 | 795 | 3.268243% |
| C | 24325 | 196 | 0.805755% |
| D | 24325 | 2557 | 10.511819% |
Noise dominated data is calculated using 1-second bins in cleaned event files. If a bin has >2000 counts, and if more than 50% of those come from <1% of pixels, then it is considered to be noise-dominated and hence unusable.
| Quadrant | # 1 sec bins | Bins with >0 counts | Bins with >2000 counts | High rate bins dominated by noise | Noise dominated (total time) | Noise dominated (detector-on time) | Marked lightcurve |
|---|---|---|---|---|---|---|---|
| A | 32059 | 24329 | 14 | 14 | 0.04% | 0.06% | 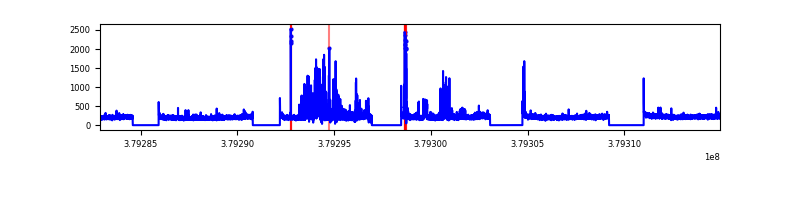 |
| B | 32059 | 24325 | 31 | 31 | 0.10% | 0.13% |  |
| C | 32059 | 24325 | 24 | 24 | 0.07% | 0.10% |  |
| D | 32059 | 24325 | 833 | 833 | 2.60% | 3.42% |  |
Top three noisy pixels from each quadrant. If the there are fewer than three noisy pixels in the level2.evt file, extra rows are filled as -1
| Pixel properties | Quadrant properties | ||||||
|---|---|---|---|---|---|---|---|
| Quadrant | DetID | PixID | Counts | Sigma | Mean | Median | Sigma |
| A | 15 | 169 | 837049 | 3035.89 | 1247 | 1224 | 275.3 |
| A | 13 | 254 | 40334 | 142.06 | 1247 | 1224 | 275.3 |
| A | 10 | 83 | 37999 | 133.57 | 1247 | 1224 | 275.3 |
| B | 5 | 172 | 1882771 | 7554.59 | 1254 | 1223 | 249.1 |
| B | 0 | 219 | 220286 | 879.56 | 1254 | 1223 | 249.1 |
| B | 4 | 232 | 118578 | 471.19 | 1254 | 1223 | 249.1 |
| C | 15 | 214 | 992387 | 3526.35 | 1233 | 1225 | 281.1 |
| C | 3 | 233 | 644605 | 2289.01 | 1233 | 1225 | 281.1 |
| C | 0 | 10 | 503489 | 1786.95 | 1233 | 1225 | 281.1 |
| D | 8 | 195 | 4520438 | 16024.42 | 1184 | 1147 | 282.0 |
| D | 8 | 230 | 2051733 | 7270.93 | 1184 | 1147 | 282.0 |
| D | 7 | 238 | 1832223 | 6492.6 | 1184 | 1147 | 282.0 |
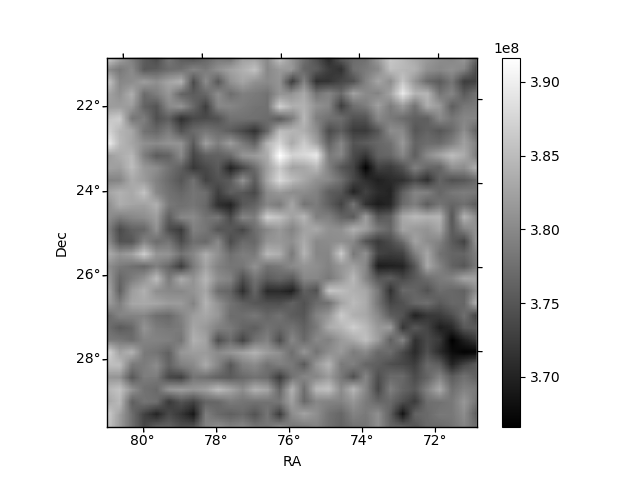
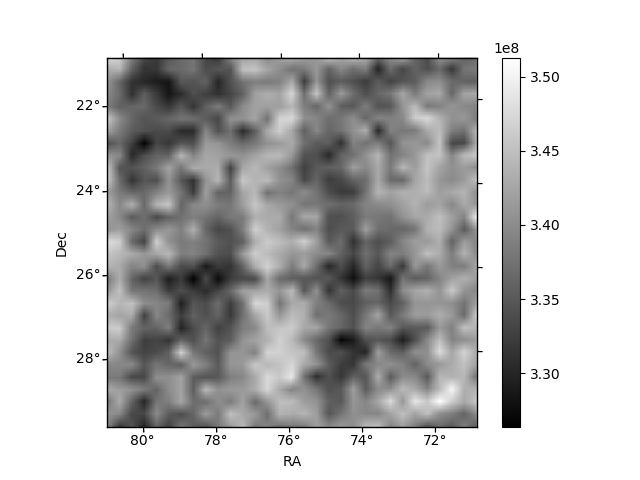
Histogram calculated using DETX and DETY for each event in the final _common_clean file
| Quadrant A |  |
 |
Quadrant B |
|---|---|---|---|
| Quadrant D |  |
 |
Quadrant C |
| Plot type | Count rate plots | Images |
|---|---|---|
| Comparison with Poisson distribution Blue bars denote a histogram of data divided into 1 sec bins. Red curve is a Poisson curve with rate = median count rate of data. |
 |
 |
| Quadrant-wise count rates Data is divided into 100 sec bins |
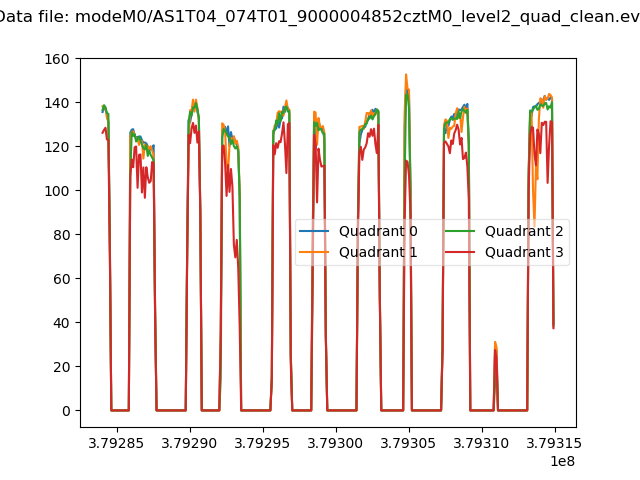 |
|
| Module-wise count rates for Quadrant A Data is divided into 100 sec bins |
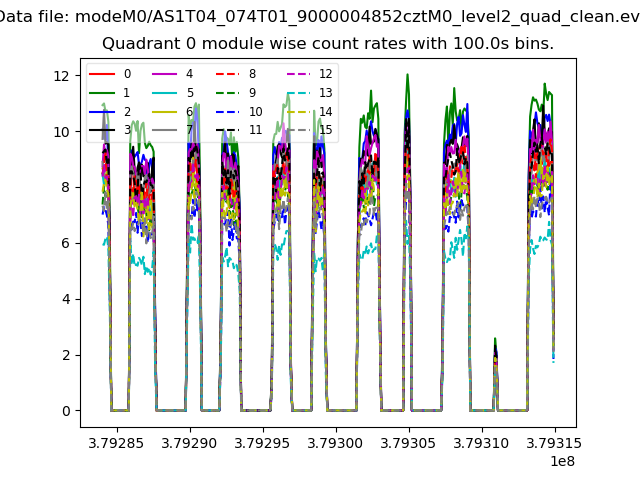 |
 |
| Module-wise count rates for Quadrant B Data is divided into 100 sec bins |
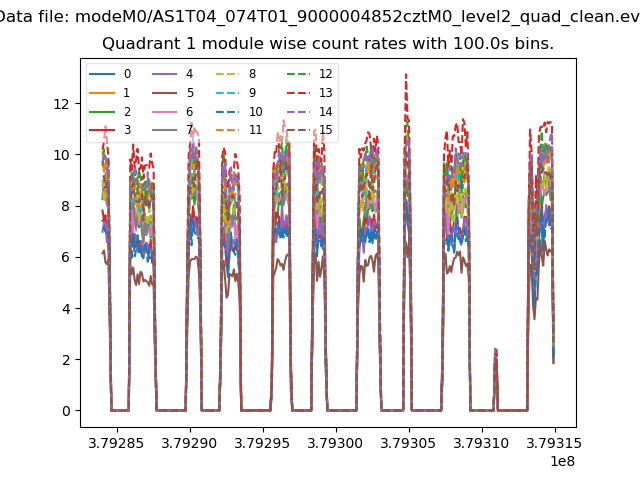 |
 |
| Module-wise count rates for Quadrant C Data is divided into 100 sec bins |
 |
 |
| Module-wise count rates for Quadrant D Data is divided into 100 sec bins |
 |
 |
| Parameter | Plot |
|---|---|
| CZT HV Monitor |  |
| D_VDD |  |
| Temperature 1 |  |
| Veto HV Monitor |  |
| Veto LLD |  |
| Alpha Counter |  |
| _CPM_Rate |  |
| CZT Counter |  |
| +2.5 Volts monitor |  |
| +5 Volts monitor |  |
| _ROLL_ROT | 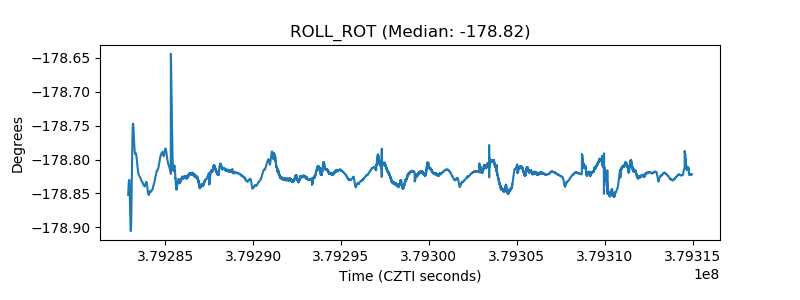 |
| _Roll_DEC |  |
| _Roll_RA |  |
| Veto Counter |  |