| Param | Original file | Final file |
|---|---|---|
| Filename | modeM0/AS1A11_068T02_9000004850cztM0_level2_bc.evt | modeM0/AS1A11_068T02_9000004850cztM0_level2_quad_clean.evt |
| Size (bytes) | 1,304,190,720 | 339,082,560 |
| Size | 1.2 GB | 323.4 MB |
| Events in quadrant A | 5,216,576 | 2,207,613 |
| Events in quadrant B | 7,990,100 | 2,195,830 |
| Events in quadrant C | 11,162,949 | 2,155,382 |
| Events in quadrant D | 13,444,253 | 2,011,591 |
| Mode M9 | |||
|---|---|---|---|
| Quadrant | BADHDUFLAG | Total packets | Discarded packets |
| A | 0 | 95 | 0 |
| B | 0 | 95 | 0 |
| C | 0 | 95 | 0 |
| D | 0 | 96 | 0 |
| Mode SS | |||
|---|---|---|---|
| Quadrant | BADHDUFLAG | Total packets | Discarded packets |
| A | 0 | 504 | 0 |
| B | 0 | 504 | 0 |
| C | 0 | 504 | 0 |
| D | 0 | 504 | 0 |
| Mode M0 | |||
|---|---|---|---|
| Quadrant | BADHDUFLAG | Total packets | Discarded packets |
| A | 0 | 50126 | 0 |
| B | 0 | 61138 | 0 |
| C | 0 | 71897 | 0 |
| D | 0 | 81681 | 0 |
| Quadrant | Total seconds | Saturated seconds | Saturation percentage |
|---|---|---|---|
| A | 24705 | 24 | 0.097146% |
| B | 24705 | 1057 | 4.278486% |
| C | 24705 | 724 | 2.930581% |
| D | 24705 | 2024 | 8.192674% |
Noise dominated data is calculated using 1-second bins in cleaned event files. If a bin has >2000 counts, and if more than 50% of those come from <1% of pixels, then it is considered to be noise-dominated and hence unusable.
| Quadrant | # 1 sec bins | Bins with >0 counts | Bins with >2000 counts | High rate bins dominated by noise | Noise dominated (total time) | Noise dominated (detector-on time) | Marked lightcurve |
|---|---|---|---|---|---|---|---|
| A | 33039 | 24708 | 0 | 0 | 0.00% | 0.00% | 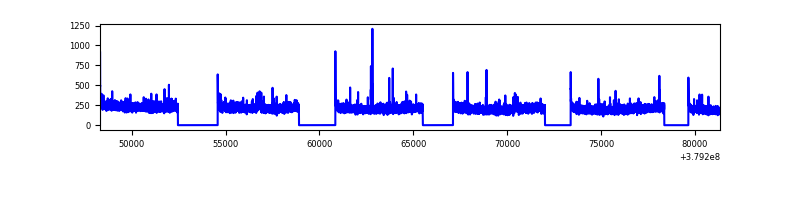 |
| B | 33038 | 24703 | 90 | 90 | 0.27% | 0.36% |  |
| C | 33038 | 24704 | 51 | 51 | 0.15% | 0.21% | 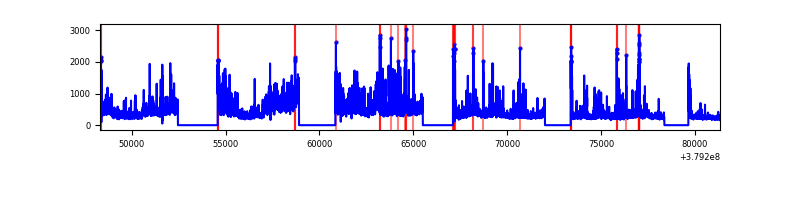 |
| D | 33039 | 24702 | 327 | 327 | 0.99% | 1.32% |  |
Top three noisy pixels from each quadrant. If the there are fewer than three noisy pixels in the level2.evt file, extra rows are filled as -1
| Pixel properties | Quadrant properties | ||||||
|---|---|---|---|---|---|---|---|
| Quadrant | DetID | PixID | Counts | Sigma | Mean | Median | Sigma |
| A | 13 | 6 | 52501 | 175.23 | 1320 | 1298 | 292.2 |
| A | 10 | 83 | 44364 | 147.38 | 1320 | 1298 | 292.2 |
| A | 13 | 254 | 39800 | 131.77 | 1320 | 1298 | 292.2 |
| B | 5 | 172 | 1472413 | 5786.12 | 1294 | 1268 | 254.3 |
| B | 0 | 182 | 845243 | 3319.42 | 1294 | 1268 | 254.3 |
| B | 4 | 81 | 111193 | 432.34 | 1294 | 1268 | 254.3 |
| C | 3 | 233 | 4088953 | 14134.51 | 1265 | 1256 | 289.2 |
| C | 15 | 214 | 1003803 | 3466.62 | 1265 | 1256 | 289.2 |
| C | 0 | 10 | 776905 | 2682.05 | 1265 | 1256 | 289.2 |
| D | 8 | 195 | 2653328 | 8485.05 | 1253 | 1216 | 312.6 |
| D | 12 | 6 | 1483716 | 4743.05 | 1253 | 1216 | 312.6 |
| D | 2 | 250 | 1123333 | 3590.05 | 1253 | 1216 | 312.6 |
Histogram calculated using DETX and DETY for each event in the final _common_clean file
| Quadrant A | 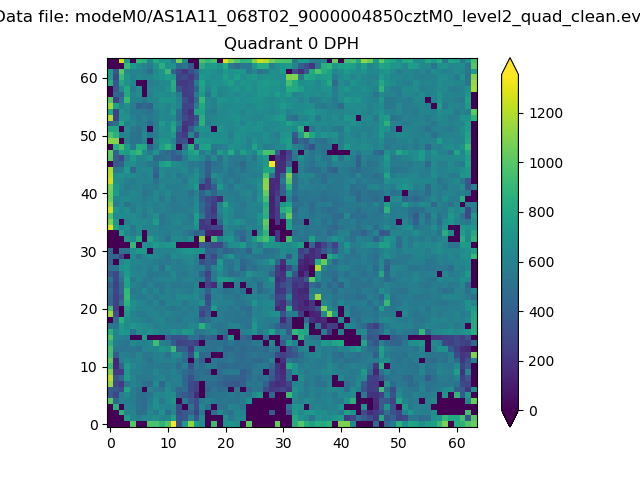 |
 |
Quadrant B |
|---|---|---|---|
| Quadrant D |  |
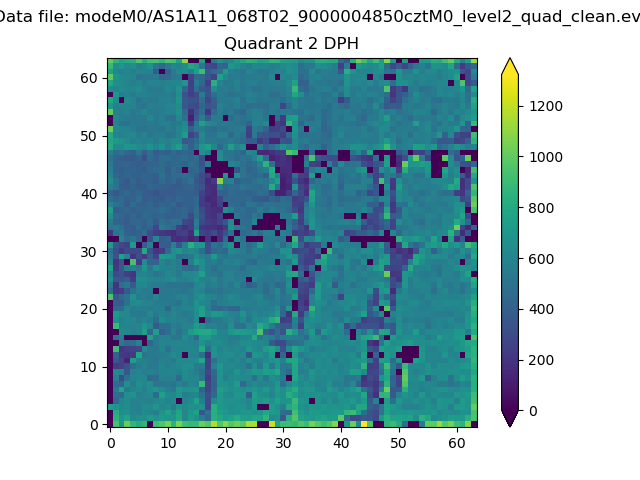 |
Quadrant C |
| Plot type | Count rate plots | Images |
|---|---|---|
| Comparison with Poisson distribution Blue bars denote a histogram of data divided into 1 sec bins. Red curve is a Poisson curve with rate = median count rate of data. |
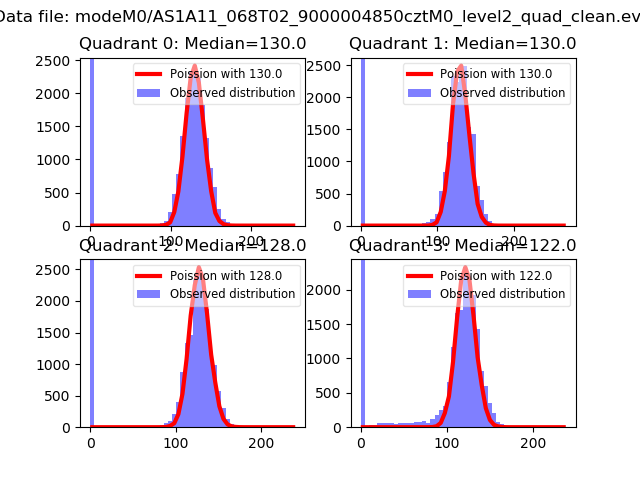 |
 |
| Quadrant-wise count rates Data is divided into 100 sec bins |
 |
|
| Module-wise count rates for Quadrant A Data is divided into 100 sec bins |
 |
 |
| Module-wise count rates for Quadrant B Data is divided into 100 sec bins |
 |
 |
| Module-wise count rates for Quadrant C Data is divided into 100 sec bins |
 |
 |
| Module-wise count rates for Quadrant D Data is divided into 100 sec bins |
 |
 |
| Parameter | Plot |
|---|---|
| CZT HV Monitor |  |
| D_VDD |  |
| Temperature 1 | 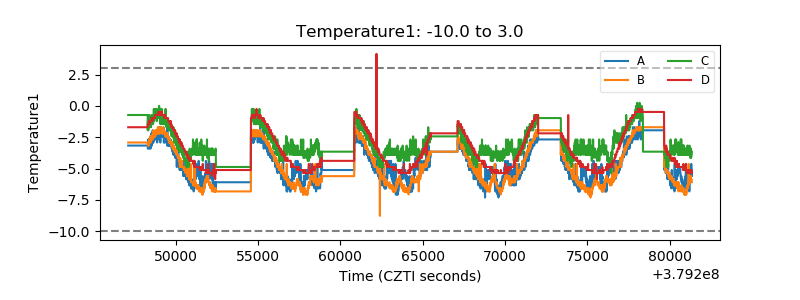 |
| Veto HV Monitor |  |
| Veto LLD |  |
| Alpha Counter |  |
| _CPM_Rate |  |
| CZT Counter |  |
| +2.5 Volts monitor |  |
| +5 Volts monitor |  |
| _ROLL_ROT | 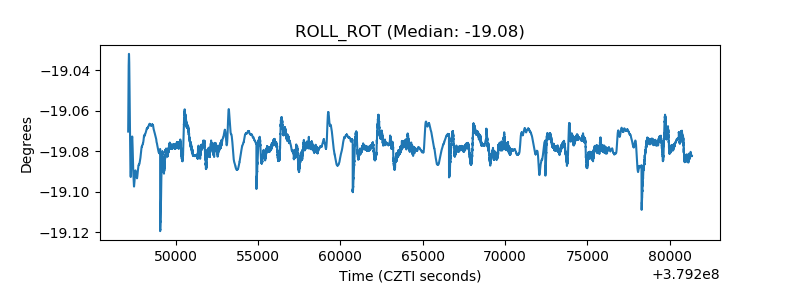 |
| _Roll_DEC | 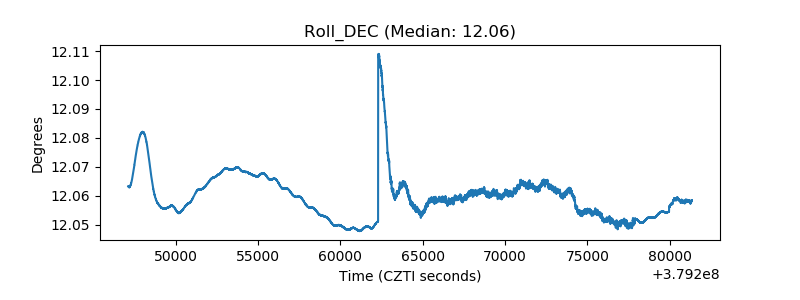 |
| _Roll_RA |  |
| Veto Counter |  |