| Param | Original file | Final file |
|---|---|---|
| Filename | modeM0/AS1A11_046T03_9000004848cztM0_level2_bc.evt | modeM0/AS1A11_046T03_9000004848cztM0_level2_quad_clean.evt |
| Size (bytes) | 2,036,269,440 | 555,258,240 |
| Size | 1.9 GB | 529.5 MB |
| Events in quadrant A | 12,271,770 | 3,486,101 |
| Events in quadrant B | 12,431,093 | 3,582,227 |
| Events in quadrant C | 13,073,276 | 3,536,060 |
| Events in quadrant D | 21,022,508 | 3,318,913 |
| Mode SS | |||
|---|---|---|---|
| Quadrant | BADHDUFLAG | Total packets | Discarded packets |
| A | 0 | 854 | 0 |
| B | 0 | 866 | 0 |
| C | 0 | 870 | 0 |
| D | 0 | 864 | 0 |
| Mode M9 | |||
|---|---|---|---|
| Quadrant | BADHDUFLAG | Total packets | Discarded packets |
| A | 0 | 144 | 0 |
| B | 0 | 145 | 0 |
| C | 0 | 145 | 0 |
| D | 0 | 145 | 0 |
| Mode M0 | |||
|---|---|---|---|
| Quadrant | BADHDUFLAG | Total packets | Discarded packets |
| A | 0 | 100175 | 0 |
| B | 0 | 100562 | 0 |
| C | 0 | 97303 | 0 |
| D | 0 | 128087 | 0 |
| Quadrant | Total seconds | Saturated seconds | Saturation percentage |
|---|---|---|---|
| A | 42018 | 1252 | 2.979675% |
| B | 42269 | 1230 | 2.909934% |
| C | 42285 | 331 | 0.782783% |
| D | 42030 | 2202 | 5.239115% |
Noise dominated data is calculated using 1-second bins in cleaned event files. If a bin has >2000 counts, and if more than 50% of those come from <1% of pixels, then it is considered to be noise-dominated and hence unusable.
| Quadrant | # 1 sec bins | Bins with >0 counts | Bins with >2000 counts | High rate bins dominated by noise | Noise dominated (total time) | Noise dominated (detector-on time) | Marked lightcurve |
|---|---|---|---|---|---|---|---|
| A | 57821 | 42504 | 9 | 9 | 0.02% | 0.02% | 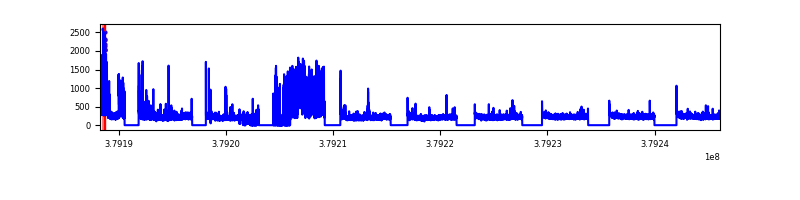 |
| B | 57821 | 42723 | 65 | 65 | 0.11% | 0.15% |  |
| C | 57821 | 42761 | 39 | 39 | 0.07% | 0.09% |  |
| D | 57821 | 42518 | 504 | 504 | 0.87% | 1.19% |  |
Top three noisy pixels from each quadrant. If the there are fewer than three noisy pixels in the level2.evt file, extra rows are filled as -1
| Pixel properties | Quadrant properties | ||||||
|---|---|---|---|---|---|---|---|
| Quadrant | DetID | PixID | Counts | Sigma | Mean | Median | Sigma |
| A | 15 | 169 | 3472269 | 7122.04 | 2222 | 2192 | 487.2 |
| A | 13 | 254 | 65417 | 129.76 | 2222 | 2192 | 487.2 |
| A | 13 | 6 | 62565 | 123.91 | 2222 | 2192 | 487.2 |
| B | 5 | 172 | 2708402 | 6198.0 | 2228 | 2183 | 436.6 |
| B | 0 | 229 | 144188 | 325.23 | 2228 | 2183 | 436.6 |
| B | 4 | 251 | 139916 | 315.45 | 2228 | 2183 | 436.6 |
| C | 15 | 214 | 1726197 | 3476.3 | 2182 | 2162 | 495.9 |
| C | 0 | 10 | 982306 | 1976.34 | 2182 | 2162 | 495.9 |
| C | 3 | 233 | 941976 | 1895.02 | 2182 | 2162 | 495.9 |
| D | 8 | 195 | 5634453 | 10605.93 | 2150 | 2087 | 531.1 |
| D | 8 | 230 | 1746039 | 3283.92 | 2150 | 2087 | 531.1 |
| D | 2 | 250 | 1460363 | 2745.98 | 2150 | 2087 | 531.1 |
Histogram calculated using DETX and DETY for each event in the final _common_clean file
| Quadrant A |  |
 |
Quadrant B |
|---|---|---|---|
| Quadrant D |  |
 |
Quadrant C |
| Plot type | Count rate plots | Images |
|---|---|---|
| Comparison with Poisson distribution Blue bars denote a histogram of data divided into 1 sec bins. Red curve is a Poisson curve with rate = median count rate of data. |
 |
 |
| Quadrant-wise count rates Data is divided into 100 sec bins |
 |
|
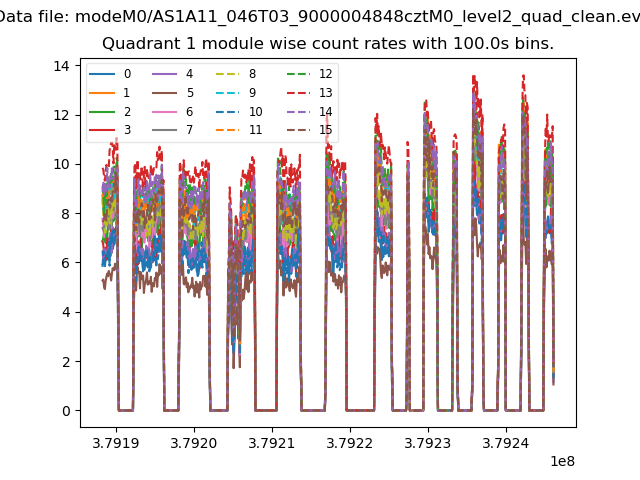
| Module-wise count rates for Quadrant A Data is divided into 100 sec bins |
 |
 |
| Module-wise count rates for Quadrant B Data is divided into 100 sec bins |
 |
 |
| Module-wise count rates for Quadrant C Data is divided into 100 sec bins |
 |
 |
| Module-wise count rates for Quadrant D Data is divided into 100 sec bins |
 |
 |
| Parameter | Plot |
|---|---|
| CZT HV Monitor |  |
| D_VDD |  |
| Temperature 1 |  |
| Veto HV Monitor |  |
| Veto LLD |  |
| Alpha Counter |  |
| _CPM_Rate |  |
| CZT Counter | 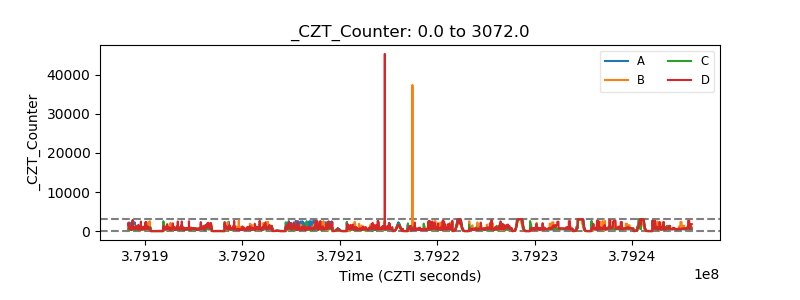 |
| +2.5 Volts monitor |  |
| +5 Volts monitor |  |
| _ROLL_ROT |  |
| _Roll_DEC |  |
| _Roll_RA | 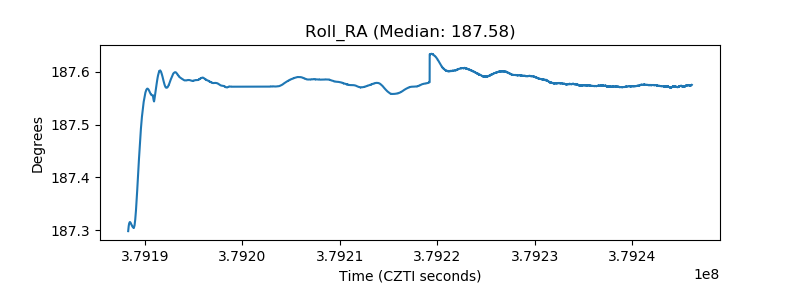 |
| Veto Counter |  |