| Param | Original file | Final file |
|---|---|---|
| Filename | modeM0/AS1T04_091T01_9000004842cztM0_level2_bc.evt | modeM0/AS1T04_091T01_9000004842cztM0_level2_quad_clean.evt |
| Size (bytes) | 3,323,471,040 | 619,911,360 |
| Size | 3.1 GB | 591.2 MB |
| Events in quadrant A | 19,417,624 | 3,524,013 |
| Events in quadrant B | 20,817,190 | 3,964,643 |
| Events in quadrant C | 16,967,887 | 3,989,280 |
| Events in quadrant D | 39,844,636 | 3,656,149 |
| Mode SS | |||
|---|---|---|---|
| Quadrant | BADHDUFLAG | Total packets | Discarded packets |
| A | 0 | 1086 | 0 |
| B | 0 | 1078 | 0 |
| C | 0 | 1078 | 0 |
| D | 0 | 1080 | 0 |
| Mode M9 | |||
|---|---|---|---|
| Quadrant | BADHDUFLAG | Total packets | Discarded packets |
| A | 0 | 205 | 0 |
| B | 0 | 205 | 0 |
| C | 0 | 206 | 0 |
| D | 0 | 206 | 0 |
| Mode M0 | |||
|---|---|---|---|
| Quadrant | BADHDUFLAG | Total packets | Discarded packets |
| A | 0 | 161757 | 0 |
| B | 0 | 144819 | 0 |
| C | 0 | 124489 | 0 |
| D | 0 | 212248 | 0 |
| Quadrant | Total seconds | Saturated seconds | Saturation percentage |
|---|---|---|---|
| A | 53109 | 7064 | 13.300947% |
| B | 53027 | 3901 | 7.356630% |
| C | 53084 | 671 | 1.264034% |
| D | 52963 | 7145 | 13.490550% |
Noise dominated data is calculated using 1-second bins in cleaned event files. If a bin has >2000 counts, and if more than 50% of those come from <1% of pixels, then it is considered to be noise-dominated and hence unusable.
| Quadrant | # 1 sec bins | Bins with >0 counts | Bins with >2000 counts | High rate bins dominated by noise | Noise dominated (total time) | Noise dominated (detector-on time) | Marked lightcurve |
|---|---|---|---|---|---|---|---|
| A | 75520 | 52782 | 198 | 198 | 0.26% | 0.38% |  |
| B | 75520 | 53203 | 720 | 720 | 0.95% | 1.35% |  |
| C | 75520 | 53260 | 116 | 116 | 0.15% | 0.22% |  |
| D | 75520 | 53050 | 739 | 739 | 0.98% | 1.39% | 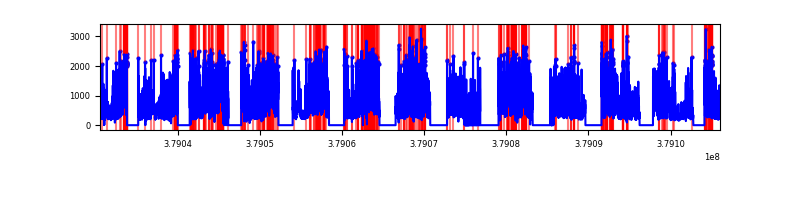 |
Top three noisy pixels from each quadrant. If the there are fewer than three noisy pixels in the level2.evt file, extra rows are filled as -1
| Pixel properties | Quadrant properties | ||||||
|---|---|---|---|---|---|---|---|
| Quadrant | DetID | PixID | Counts | Sigma | Mean | Median | Sigma |
| A | 15 | 169 | 8965512 | 15882.1 | 2567 | 2533 | 564.3 |
| A | 7 | 16 | 392506 | 691.02 | 2567 | 2533 | 564.3 |
| A | 13 | 254 | 76448 | 130.97 | 2567 | 2533 | 564.3 |
| B | 5 | 172 | 4506018 | 8400.3 | 2744 | 2686 | 536.1 |
| B | 4 | 251 | 3837893 | 7154.01 | 2744 | 2686 | 536.1 |
| B | 0 | 219 | 360219 | 666.92 | 2744 | 2686 | 536.1 |
| C | 15 | 214 | 2189024 | 3501.15 | 2758 | 2737 | 624.4 |
| C | 0 | 10 | 1502188 | 2401.24 | 2758 | 2737 | 624.4 |
| C | 0 | 207 | 1141629 | 1823.84 | 2758 | 2737 | 624.4 |
| D | 8 | 195 | 11378918 | 18352.01 | 2612 | 2531 | 619.9 |
| D | 1 | 52 | 7101770 | 11452.25 | 2612 | 2531 | 619.9 |
| D | 12 | 235 | 4381095 | 7063.35 | 2612 | 2531 | 619.9 |
Histogram calculated using DETX and DETY for each event in the final _common_clean file
| Quadrant A |  |
 |
Quadrant B |
|---|---|---|---|
| Quadrant D |  |
 |
Quadrant C |
| Plot type | Count rate plots | Images |
|---|---|---|
| Comparison with Poisson distribution Blue bars denote a histogram of data divided into 1 sec bins. Red curve is a Poisson curve with rate = median count rate of data. |
 |
 |
| Quadrant-wise count rates Data is divided into 100 sec bins |
 |
|
| Module-wise count rates for Quadrant A Data is divided into 100 sec bins |
 |
 |
| Module-wise count rates for Quadrant B Data is divided into 100 sec bins |
 |
 |
| Module-wise count rates for Quadrant C Data is divided into 100 sec bins |
 |
 |
| Module-wise count rates for Quadrant D Data is divided into 100 sec bins |
 |
 |
| Parameter | Plot |
|---|---|
| CZT HV Monitor | 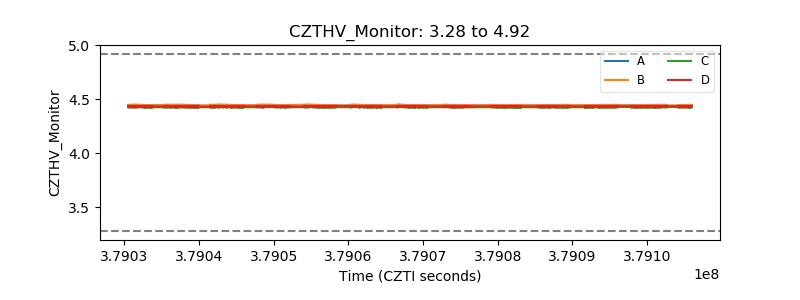 |
| D_VDD |  |
| Temperature 1 |  |
| Veto HV Monitor |  |
| Veto LLD | 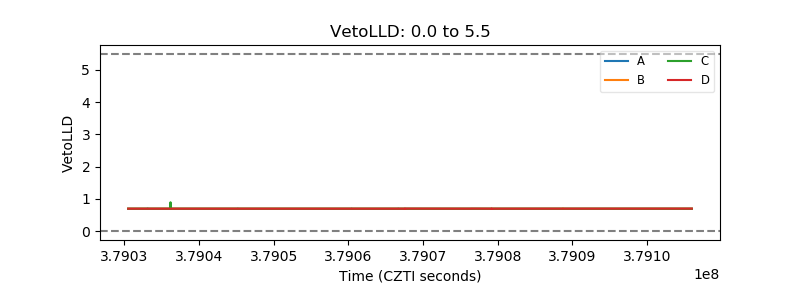 |
| Alpha Counter |  |
| _CPM_Rate | 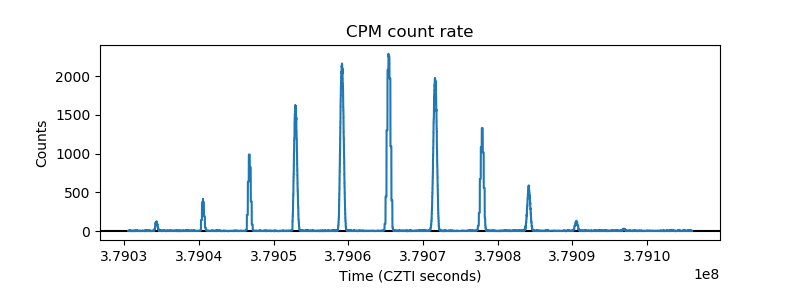 |
| CZT Counter |  |
| +2.5 Volts monitor |  |
| +5 Volts monitor |  |
| _ROLL_ROT |  |
| _Roll_DEC |  |
| _Roll_RA |  |
| Veto Counter | 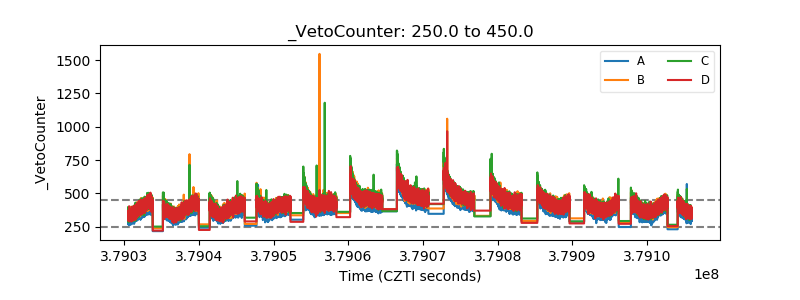 |