| Param | Original file | Final file |
|---|---|---|
| Filename | modeM0/AS1A11_068T01_9000004836cztM0_level2_bc.evt | modeM0/AS1A11_068T01_9000004836cztM0_level2_quad_clean.evt |
| Size (bytes) | 1,501,721,280 | 368,873,280 |
| Size | 1.4 GB | 351.8 MB |
| Events in quadrant A | 7,358,646 | 2,406,183 |
| Events in quadrant B | 9,951,208 | 2,350,392 |
| Events in quadrant C | 10,739,276 | 2,393,169 |
| Events in quadrant D | 15,601,297 | 2,175,305 |
| Mode M9 | |||
|---|---|---|---|
| Quadrant | BADHDUFLAG | Total packets | Discarded packets |
| A | 0 | 117 | 0 |
| B | 0 | 117 | 0 |
| C | 0 | 117 | 0 |
| D | 0 | 118 | 0 |
| Mode M0 | |||
|---|---|---|---|
| Quadrant | BADHDUFLAG | Total packets | Discarded packets |
| A | 0 | 60968 | 0 |
| B | 0 | 72046 | 0 |
| C | 0 | 72267 | 0 |
| D | 0 | 95550 | 0 |
| Mode SS | |||
|---|---|---|---|
| Quadrant | BADHDUFLAG | Total packets | Discarded packets |
| A | 0 | 546 | 0 |
| B | 0 | 546 | 0 |
| C | 0 | 546 | 0 |
| D | 0 | 546 | 0 |
| Quadrant | Total seconds | Saturated seconds | Saturation percentage |
|---|---|---|---|
| A | 26863 | 831 | 3.093474% |
| B | 26863 | 1452 | 5.405204% |
| C | 26863 | 654 | 2.434575% |
| D | 26863 | 2983 | 11.104493% |
Noise dominated data is calculated using 1-second bins in cleaned event files. If a bin has >2000 counts, and if more than 50% of those come from <1% of pixels, then it is considered to be noise-dominated and hence unusable.
| Quadrant | # 1 sec bins | Bins with >0 counts | Bins with >2000 counts | High rate bins dominated by noise | Noise dominated (total time) | Noise dominated (detector-on time) | Marked lightcurve |
|---|---|---|---|---|---|---|---|
| A | 37888 | 26867 | 11 | 11 | 0.03% | 0.04% |  |
| B | 37888 | 26862 | 90 | 90 | 0.24% | 0.34% |  |
| C | 37888 | 26862 | 81 | 81 | 0.21% | 0.30% | 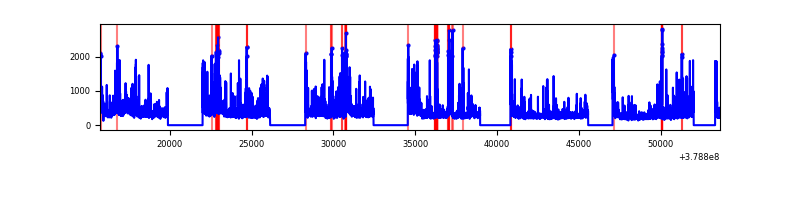 |
| D | 37888 | 26863 | 260 | 260 | 0.69% | 0.97% |  |
Top three noisy pixels from each quadrant. If the there are fewer than three noisy pixels in the level2.evt file, extra rows are filled as -1
| Pixel properties | Quadrant properties | ||||||
|---|---|---|---|---|---|---|---|
| Quadrant | DetID | PixID | Counts | Sigma | Mean | Median | Sigma |
| A | 15 | 169 | 1552122 | 4799.75 | 1476 | 1459 | 323.1 |
| A | 13 | 6 | 65248 | 197.45 | 1476 | 1459 | 323.1 |
| A | 13 | 254 | 44231 | 132.39 | 1476 | 1459 | 323.1 |
| B | 5 | 172 | 3548133 | 12329.73 | 1458 | 1430 | 287.7 |
| B | 4 | 232 | 127644 | 438.77 | 1458 | 1430 | 287.7 |
| B | 0 | 199 | 91509 | 313.15 | 1458 | 1430 | 287.7 |
| C | 3 | 233 | 1563218 | 4815.17 | 1445 | 1438 | 324.3 |
| C | 0 | 10 | 1207432 | 3718.24 | 1445 | 1438 | 324.3 |
| C | 15 | 214 | 1088895 | 3352.77 | 1445 | 1438 | 324.3 |
| D | 12 | 235 | 4858107 | 14570.91 | 1405 | 1363 | 333.3 |
| D | 8 | 195 | 1894652 | 5680.13 | 1405 | 1363 | 333.3 |
| D | 2 | 249 | 639780 | 1915.34 | 1405 | 1363 | 333.3 |
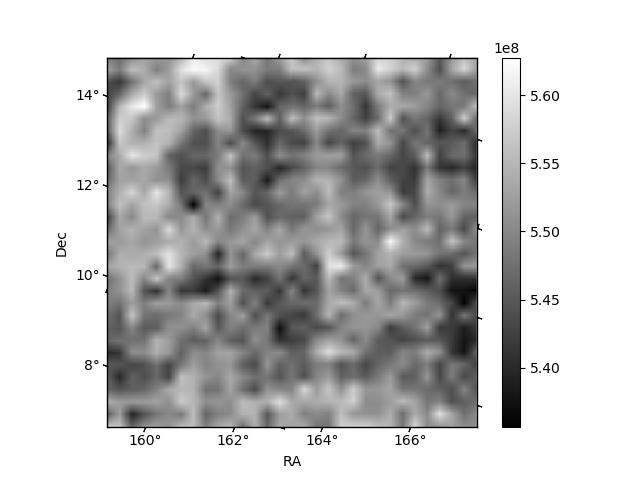
Histogram calculated using DETX and DETY for each event in the final _common_clean file
| Quadrant A |  |
 |
Quadrant B |
|---|---|---|---|
| Quadrant D |  |
 |
Quadrant C |
| Plot type | Count rate plots | Images |
|---|---|---|
| Comparison with Poisson distribution Blue bars denote a histogram of data divided into 1 sec bins. Red curve is a Poisson curve with rate = median count rate of data. |
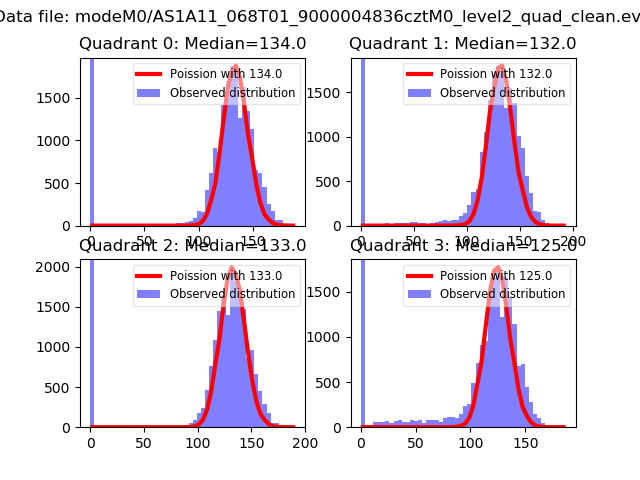 |
 |
| Quadrant-wise count rates Data is divided into 100 sec bins |
 |
|
| Module-wise count rates for Quadrant A Data is divided into 100 sec bins |
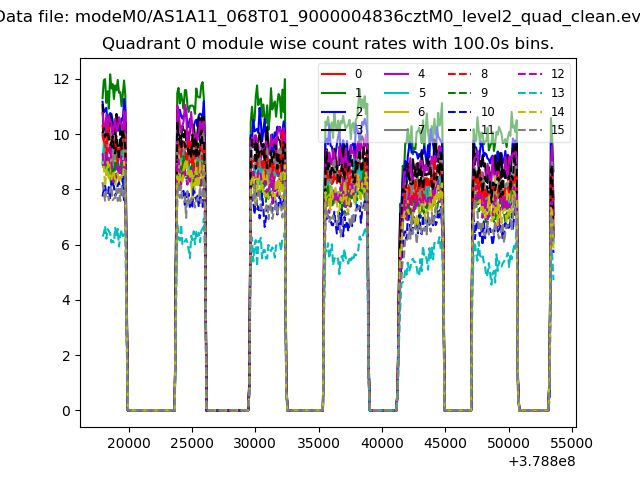 |
 |
| Module-wise count rates for Quadrant B Data is divided into 100 sec bins |
 |
 |
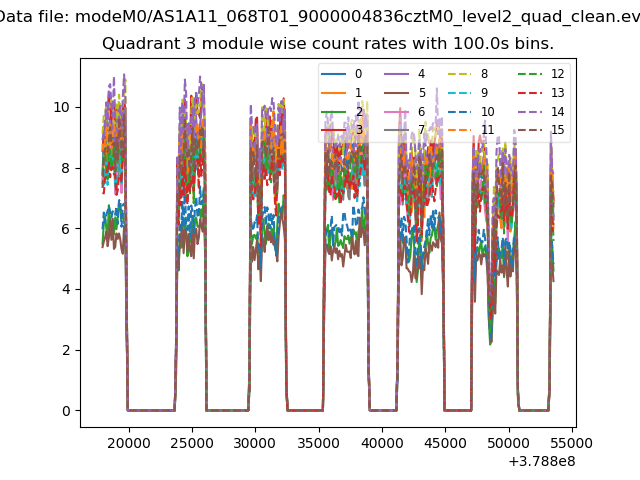
| Module-wise count rates for Quadrant C Data is divided into 100 sec bins |
 |
 |
| Module-wise count rates for Quadrant D Data is divided into 100 sec bins |
 |
 |
| Parameter | Plot |
|---|---|
| CZT HV Monitor |  |
| D_VDD |  |
| Temperature 1 |  |
| Veto HV Monitor |  |
| Veto LLD |  |
| Alpha Counter |  |
| _CPM_Rate |  |
| CZT Counter |  |
| +2.5 Volts monitor |  |
| +5 Volts monitor |  |
| _ROLL_ROT | 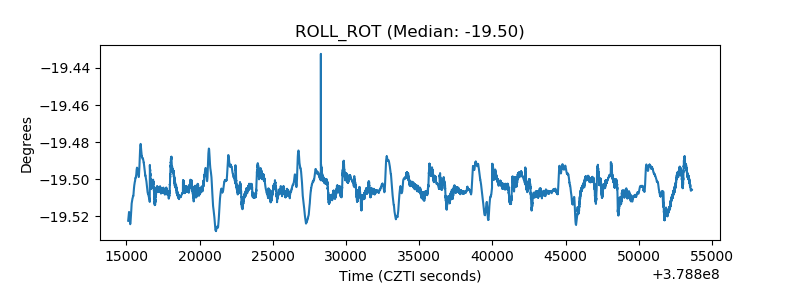 |
| _Roll_DEC |  |
| _Roll_RA |  |
| Veto Counter |  |