| Param | Original file | Final file |
|---|---|---|
| Filename | modeM0/AS1A11_003T10_9000004838cztM0_level2_bc.evt | modeM0/AS1A11_003T10_9000004838cztM0_level2_quad_clean.evt |
| Size (bytes) | 1,248,384,960 | 347,693,760 |
| Size | 1.2 GB | 331.6 MB |
| Events in quadrant A | 8,956,664 | 2,198,434 |
| Events in quadrant B | 7,856,050 | 2,225,947 |
| Events in quadrant C | 8,328,840 | 2,199,970 |
| Events in quadrant D | 10,867,709 | 2,093,228 |
| Mode M0 | |||
|---|---|---|---|
| Quadrant | BADHDUFLAG | Total packets | Discarded packets |
| A | 0 | 65554 | 0 |
| B | 0 | 62938 | 0 |
| C | 0 | 60997 | 0 |
| D | 0 | 74214 | 0 |
| Mode M9 | |||
|---|---|---|---|
| Quadrant | BADHDUFLAG | Total packets | Discarded packets |
| A | 0 | 75 | 0 |
| B | 0 | 75 | 0 |
| C | 0 | 75 | 0 |
| D | 0 | 75 | 0 |
| Mode SS | |||
|---|---|---|---|
| Quadrant | BADHDUFLAG | Total packets | Discarded packets |
| A | 0 | 536 | 0 |
| B | 0 | 536 | 0 |
| C | 0 | 536 | 0 |
| D | 0 | 536 | 0 |
| Quadrant | Total seconds | Saturated seconds | Saturation percentage |
|---|---|---|---|
| A | 26368 | 1168 | 4.429612% |
| B | 26368 | 715 | 2.711620% |
| C | 26368 | 464 | 1.759709% |
| D | 26368 | 1286 | 4.877124% |
Noise dominated data is calculated using 1-second bins in cleaned event files. If a bin has >2000 counts, and if more than 50% of those come from <1% of pixels, then it is considered to be noise-dominated and hence unusable.
| Quadrant | # 1 sec bins | Bins with >0 counts | Bins with >2000 counts | High rate bins dominated by noise | Noise dominated (total time) | Noise dominated (detector-on time) | Marked lightcurve |
|---|---|---|---|---|---|---|---|
| A | 33773 | 26370 | 212 | 212 | 0.63% | 0.80% |  |
| B | 33773 | 26367 | 33 | 33 | 0.10% | 0.13% | 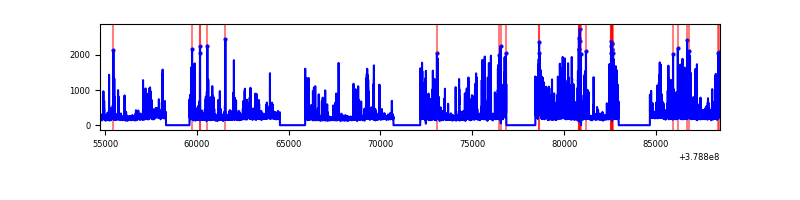 |
| C | 33773 | 26368 | 91 | 91 | 0.27% | 0.35% |  |
| D | 33773 | 26367 | 78 | 78 | 0.23% | 0.30% |  |
Top three noisy pixels from each quadrant. If the there are fewer than three noisy pixels in the level2.evt file, extra rows are filled as -1
| Pixel properties | Quadrant properties | ||||||
|---|---|---|---|---|---|---|---|
| Quadrant | DetID | PixID | Counts | Sigma | Mean | Median | Sigma |
| A | 15 | 169 | 3729820 | 12823.72 | 1322 | 1300 | 290.8 |
| A | 13 | 6 | 75155 | 254.01 | 1322 | 1300 | 290.8 |
| A | 13 | 254 | 43868 | 146.41 | 1322 | 1300 | 290.8 |
| B | 5 | 172 | 1282509 | 4813.43 | 1345 | 1317 | 266.2 |
| B | 5 | 255 | 520696 | 1951.3 | 1345 | 1317 | 266.2 |
| B | 4 | 251 | 335486 | 1255.47 | 1345 | 1317 | 266.2 |
| C | 15 | 214 | 1068386 | 3575.95 | 1315 | 1309 | 298.4 |
| C | 0 | 10 | 1030679 | 3449.59 | 1315 | 1309 | 298.4 |
| C | 0 | 207 | 522157 | 1745.45 | 1315 | 1309 | 298.4 |
| D | 12 | 235 | 1626970 | 5228.55 | 1301 | 1258 | 310.9 |
| D | 8 | 195 | 1405380 | 4515.88 | 1301 | 1258 | 310.9 |
| D | 2 | 250 | 967773 | 3108.46 | 1301 | 1258 | 310.9 |
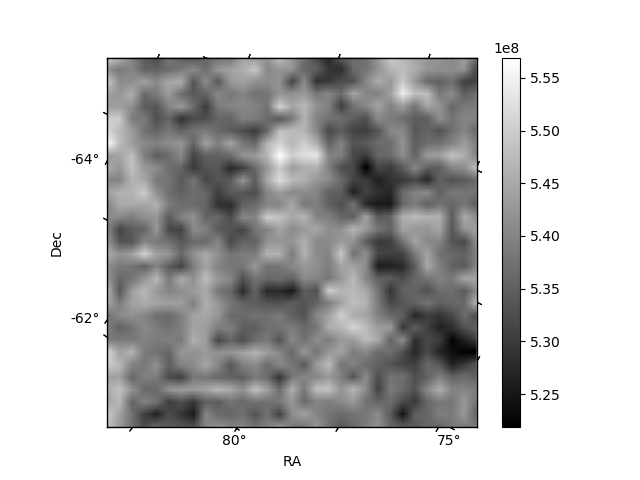
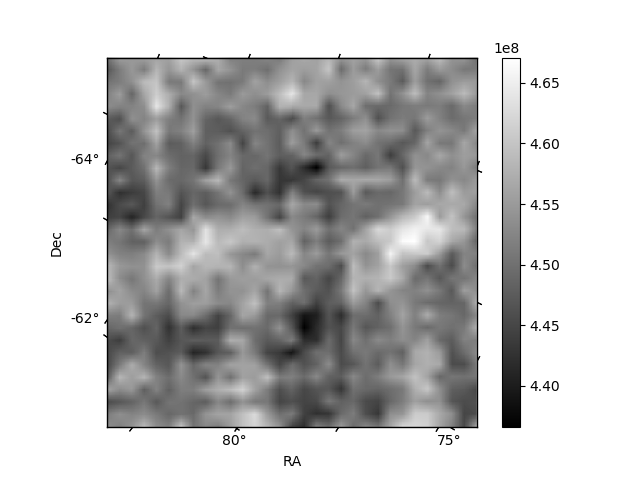
Histogram calculated using DETX and DETY for each event in the final _common_clean file
| Quadrant A |  |
 |
Quadrant B |
|---|---|---|---|
| Quadrant D |  |
 |
Quadrant C |
| Plot type | Count rate plots | Images |
|---|---|---|
| Comparison with Poisson distribution Blue bars denote a histogram of data divided into 1 sec bins. Red curve is a Poisson curve with rate = median count rate of data. |
 |
 |
| Quadrant-wise count rates Data is divided into 100 sec bins |
 |
|
| Module-wise count rates for Quadrant A Data is divided into 100 sec bins |
 |
 |
| Module-wise count rates for Quadrant B Data is divided into 100 sec bins |
 |
 |
| Module-wise count rates for Quadrant C Data is divided into 100 sec bins |
 |
 |
| Module-wise count rates for Quadrant D Data is divided into 100 sec bins |
 |
 |
| Parameter | Plot |
|---|---|
| CZT HV Monitor | 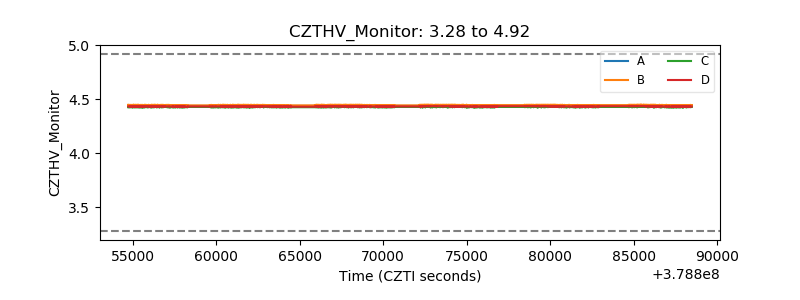 |
| D_VDD |  |
| Temperature 1 |  |
| Veto HV Monitor |  |
| Veto LLD |  |
| Alpha Counter |  |
| _CPM_Rate |  |
| CZT Counter |  |
| +2.5 Volts monitor |  |
| +5 Volts monitor |  |
| _ROLL_ROT |  |
| _Roll_DEC |  |
| _Roll_RA |  |
| Veto Counter |  |