| Param | Original file | Final file |
|---|---|---|
| Filename | modeM0/AS1T04_089T01_9000004832cztM0_level2_bc.evt | modeM0/AS1T04_089T01_9000004832cztM0_level2_quad_clean.evt |
| Size (bytes) | 1,228,682,880 | 317,252,160 |
| Size | 1.1 GB | 302.6 MB |
| Events in quadrant A | 6,060,227 | 2,049,492 |
| Events in quadrant B | 8,179,377 | 1,990,015 |
| Events in quadrant C | 7,383,695 | 2,027,754 |
| Events in quadrant D | 13,958,830 | 1,896,836 |
| Mode M0 | |||
|---|---|---|---|
| Quadrant | BADHDUFLAG | Total packets | Discarded packets |
| A | 0 | 50228 | 0 |
| B | 0 | 61462 | 0 |
| C | 0 | 54913 | 0 |
| D | 0 | 79717 | 0 |
| Mode M9 | |||
|---|---|---|---|
| Quadrant | BADHDUFLAG | Total packets | Discarded packets |
| A | 0 | 121 | 0 |
| B | 0 | 121 | 0 |
| C | 0 | 121 | 0 |
| D | 0 | 121 | 0 |
| Mode SS | |||
|---|---|---|---|
| Quadrant | BADHDUFLAG | Total packets | Discarded packets |
| A | 0 | 490 | 0 |
| B | 0 | 490 | 0 |
| C | 0 | 490 | 0 |
| D | 0 | 490 | 0 |
| Quadrant | Total seconds | Saturated seconds | Saturation percentage |
|---|---|---|---|
| A | 23907 | 30 | 0.125486% |
| B | 23911 | 1067 | 4.462381% |
| C | 23905 | 274 | 1.146204% |
| D | 23903 | 819 | 3.426348% |
Noise dominated data is calculated using 1-second bins in cleaned event files. If a bin has >2000 counts, and if more than 50% of those come from <1% of pixels, then it is considered to be noise-dominated and hence unusable.
| Quadrant | # 1 sec bins | Bins with >0 counts | Bins with >2000 counts | High rate bins dominated by noise | Noise dominated (total time) | Noise dominated (detector-on time) | Marked lightcurve |
|---|---|---|---|---|---|---|---|
| A | 36018 | 23915 | 1 | 1 | 0.00% | 0.00% |  |
| B | 36018 | 23912 | 40 | 40 | 0.11% | 0.17% | 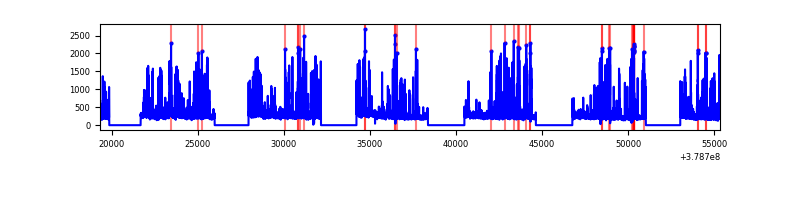 |
| C | 36018 | 23912 | 23 | 23 | 0.06% | 0.10% |  |
| D | 36018 | 23910 | 36 | 36 | 0.10% | 0.15% | 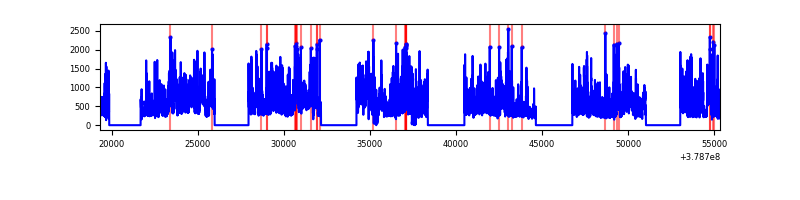 |
Top three noisy pixels from each quadrant. If the there are fewer than three noisy pixels in the level2.evt file, extra rows are filled as -1
| Pixel properties | Quadrant properties | ||||||
|---|---|---|---|---|---|---|---|
| Quadrant | DetID | PixID | Counts | Sigma | Mean | Median | Sigma |
| A | 15 | 169 | 577252 | 1898.25 | 1395 | 1379 | 303.4 |
| A | 13 | 6 | 49184 | 157.58 | 1395 | 1379 | 303.4 |
| A | 13 | 254 | 39316 | 125.05 | 1395 | 1379 | 303.4 |
| B | 5 | 172 | 2074394 | 7847.6 | 1358 | 1335 | 264.2 |
| B | 5 | 255 | 173739 | 652.64 | 1358 | 1335 | 264.2 |
| B | 0 | 229 | 103326 | 386.09 | 1358 | 1335 | 264.2 |
| C | 15 | 214 | 974077 | 3231.12 | 1345 | 1340 | 301.1 |
| C | 0 | 10 | 436343 | 1444.94 | 1345 | 1340 | 301.1 |
| C | 14 | 254 | 265522 | 877.53 | 1345 | 1340 | 301.1 |
| D | 8 | 195 | 4800284 | 14235.8 | 1341 | 1310 | 337.1 |
| D | 12 | 235 | 1221356 | 3619.17 | 1341 | 1310 | 337.1 |
| D | 2 | 250 | 943072 | 2793.67 | 1341 | 1310 | 337.1 |
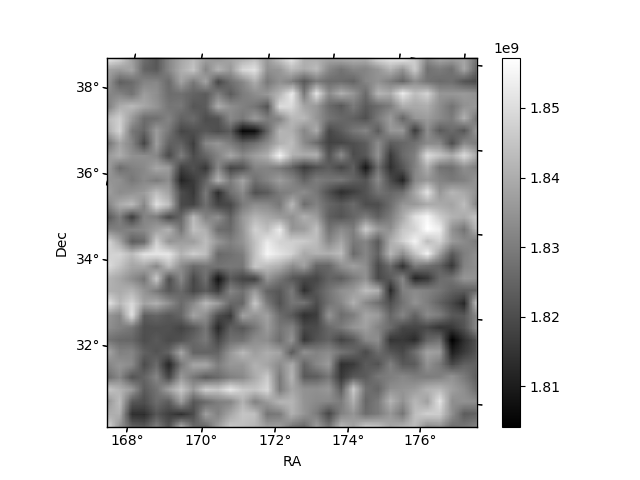
Histogram calculated using DETX and DETY for each event in the final _common_clean file
| Quadrant A |  |
 |
Quadrant B |
|---|---|---|---|
| Quadrant D |  |
 |
Quadrant C |
| Plot type | Count rate plots | Images |
|---|---|---|
| Comparison with Poisson distribution Blue bars denote a histogram of data divided into 1 sec bins. Red curve is a Poisson curve with rate = median count rate of data. |
 |
 |
| Quadrant-wise count rates Data is divided into 100 sec bins |
 |
|
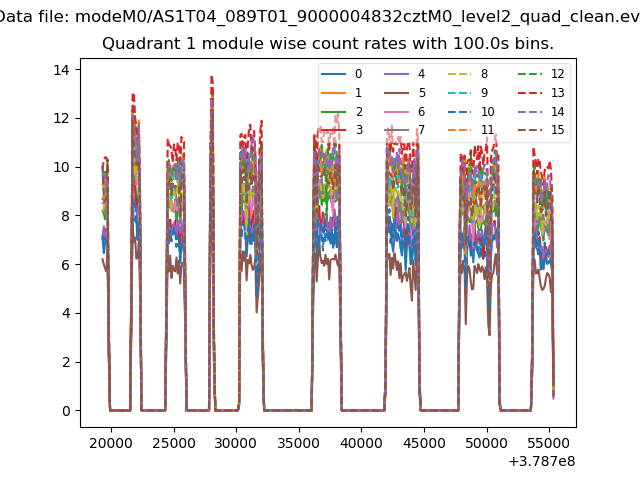
| Module-wise count rates for Quadrant A Data is divided into 100 sec bins |
 |
 |
| Module-wise count rates for Quadrant B Data is divided into 100 sec bins |
 |
 |
| Module-wise count rates for Quadrant C Data is divided into 100 sec bins |
 |
 |
| Module-wise count rates for Quadrant D Data is divided into 100 sec bins |
 |
 |
| Parameter | Plot |
|---|---|
| CZT HV Monitor |  |
| D_VDD |  |
| Temperature 1 |  |
| Veto HV Monitor |  |
| Veto LLD |  |
| Alpha Counter |  |
| _CPM_Rate |  |
| CZT Counter |  |
| +2.5 Volts monitor |  |
| +5 Volts monitor |  |
| _ROLL_ROT |  |
| _Roll_DEC |  |
| _Roll_RA |  |
| Veto Counter |  |