| Param | Original file | Final file |
|---|---|---|
| Filename | modeM0/AS1A11_046T03_9000004834cztM0_level2_bc.evt | modeM0/AS1A11_046T03_9000004834cztM0_level2_quad_clean.evt |
| Size (bytes) | 1,961,951,040 | 506,502,720 |
| Size | 1.8 GB | 483.0 MB |
| Events in quadrant A | 9,179,868 | 3,107,269 |
| Events in quadrant B | 12,695,815 | 3,222,016 |
| Events in quadrant C | 11,371,968 | 3,254,193 |
| Events in quadrant D | 23,469,594 | 3,032,873 |
| Mode M9 | |||
|---|---|---|---|
| Quadrant | BADHDUFLAG | Total packets | Discarded packets |
| A | 0 | 139 | 0 |
| B | 0 | 139 | 0 |
| C | 0 | 139 | 0 |
| D | 0 | 139 | 0 |
| Mode M0 | |||
|---|---|---|---|
| Quadrant | BADHDUFLAG | Total packets | Discarded packets |
| A | 0 | 92771 | 0 |
| B | 0 | 99317 | 0 |
| C | 0 | 88282 | 0 |
| D | 0 | 133173 | 0 |
| Mode SS | |||
|---|---|---|---|
| Quadrant | BADHDUFLAG | Total packets | Discarded packets |
| A | 0 | 814 | 0 |
| B | 0 | 814 | 0 |
| C | 0 | 814 | 0 |
| D | 0 | 814 | 0 |
| Quadrant | Total seconds | Saturated seconds | Saturation percentage |
|---|---|---|---|
| A | 39657 | 2153 | 5.429054% |
| B | 39657 | 1707 | 4.304410% |
| C | 39657 | 332 | 0.837179% |
| D | 39656 | 2240 | 5.648578% |
Noise dominated data is calculated using 1-second bins in cleaned event files. If a bin has >2000 counts, and if more than 50% of those come from <1% of pixels, then it is considered to be noise-dominated and hence unusable.
| Quadrant | # 1 sec bins | Bins with >0 counts | Bins with >2000 counts | High rate bins dominated by noise | Noise dominated (total time) | Noise dominated (detector-on time) | Marked lightcurve |
|---|---|---|---|---|---|---|---|
| A | 57504 | 39661 | 2 | 2 | 0.00% | 0.01% |  |
| B | 57504 | 39658 | 43 | 43 | 0.07% | 0.11% |  |
| C | 57504 | 39658 | 13 | 13 | 0.02% | 0.03% |  |
| D | 57504 | 39657 | 224 | 224 | 0.39% | 0.56% |  |
Top three noisy pixels from each quadrant. If the there are fewer than three noisy pixels in the level2.evt file, extra rows are filled as -1
| Pixel properties | Quadrant properties | ||||||
|---|---|---|---|---|---|---|---|
| Quadrant | DetID | PixID | Counts | Sigma | Mean | Median | Sigma |
| A | 15 | 169 | 1236504 | 2816.62 | 1998 | 1966 | 438.3 |
| A | 13 | 6 | 121359 | 272.4 | 1998 | 1966 | 438.3 |
| A | 13 | 254 | 59679 | 131.67 | 1998 | 1966 | 438.3 |
| B | 5 | 172 | 3556217 | 8921.21 | 2024 | 1980 | 398.4 |
| B | 0 | 229 | 195973 | 486.93 | 2024 | 1980 | 398.4 |
| B | 15 | 222 | 183654 | 456.0 | 2024 | 1980 | 398.4 |
| C | 15 | 214 | 1608068 | 3530.46 | 2004 | 1992 | 454.9 |
| C | 3 | 233 | 716593 | 1570.83 | 2004 | 1992 | 454.9 |
| C | 0 | 10 | 627020 | 1373.93 | 2004 | 1992 | 454.9 |
| D | 8 | 195 | 8585310 | 18009.89 | 1981 | 1921 | 476.6 |
| D | 12 | 235 | 1700000 | 3562.95 | 1981 | 1921 | 476.6 |
| D | 13 | 249 | 1167937 | 2446.56 | 1981 | 1921 | 476.6 |
Histogram calculated using DETX and DETY for each event in the final _common_clean file
| Quadrant A |  |
 |
Quadrant B |
|---|---|---|---|
| Quadrant D |  |
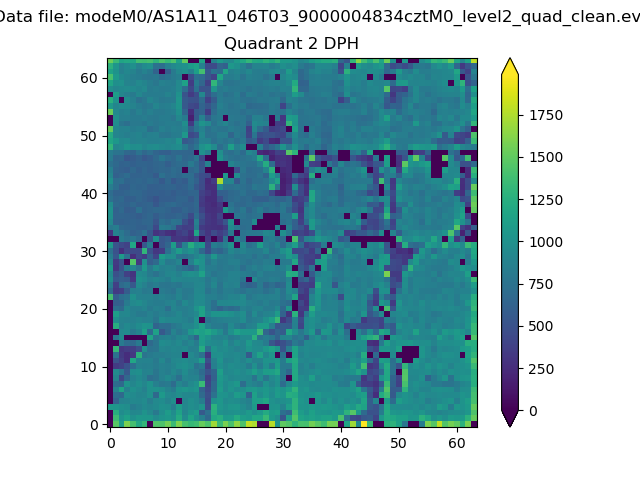 |
Quadrant C |
| Plot type | Count rate plots | Images |
|---|---|---|
| Comparison with Poisson distribution Blue bars denote a histogram of data divided into 1 sec bins. Red curve is a Poisson curve with rate = median count rate of data. |
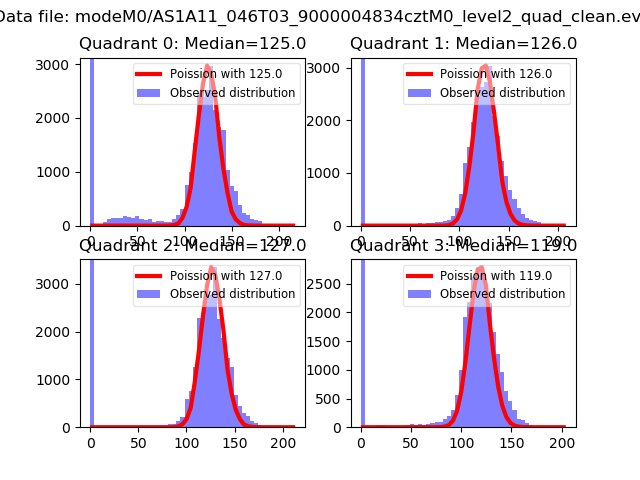 |
 |
| Quadrant-wise count rates Data is divided into 100 sec bins |
 |
|
| Module-wise count rates for Quadrant A Data is divided into 100 sec bins |
 |
 |
| Module-wise count rates for Quadrant B Data is divided into 100 sec bins |
 |
 |
| Module-wise count rates for Quadrant C Data is divided into 100 sec bins |
 |
 |
| Module-wise count rates for Quadrant D Data is divided into 100 sec bins |
 |
 |
| Parameter | Plot |
|---|---|
| CZT HV Monitor |  |
| D_VDD |  |
| Temperature 1 |  |
| Veto HV Monitor |  |
| Veto LLD |  |
| Alpha Counter |  |
| _CPM_Rate | 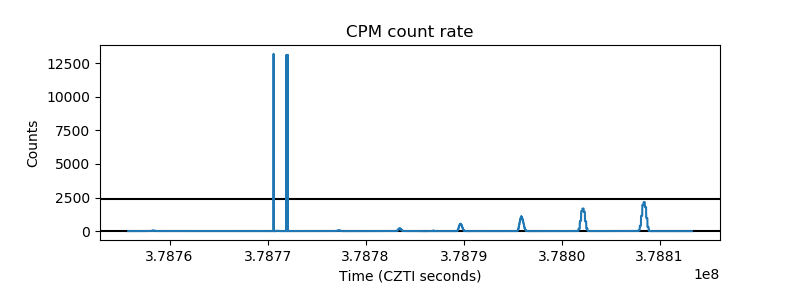 |
| CZT Counter |  |
| +2.5 Volts monitor |  |
| +5 Volts monitor |  |
| _ROLL_ROT | 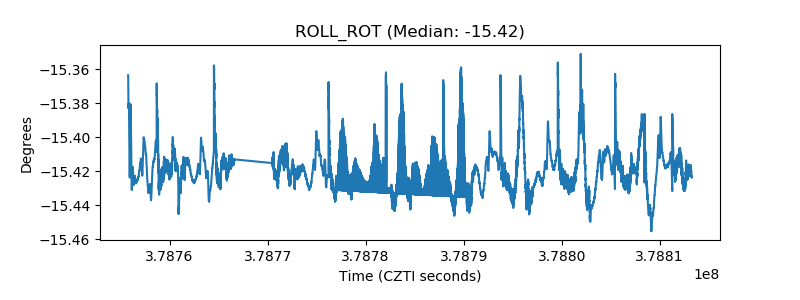 |
| _Roll_DEC | 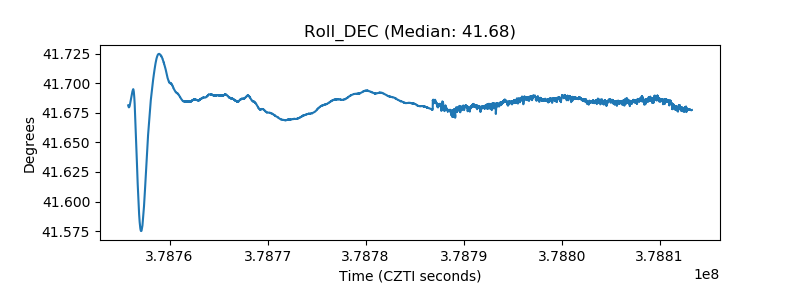 |
| _Roll_RA |  |
| Veto Counter |  |