| Param | Original file | Final file |
|---|---|---|
| Filename | modeM0/AS1A10_094T10_9000004262cztM0_level2_bc.evt | modeM0/AS1A10_094T10_9000004262cztM0_level2_quad_clean.evt |
| Size (bytes) | 293,866,560 | 72,158,400 |
| Size | 280.3 MB | 68.8 MB |
| Events in quadrant A | 1,011,783 | 482,443 |
| Events in quadrant B | 1,040,133 | 496,562 |
| Events in quadrant C | 1,019,156 | 459,264 |
| Events in quadrant D | 5,505,949 | 420,076 |
| Mode SS | |||
|---|---|---|---|
| Quadrant | BADHDUFLAG | Total packets | Discarded packets |
| A | 0 | 96 | 0 |
| B | 0 | 96 | 0 |
| C | 0 | 96 | 0 |
| D | 0 | 96 | 0 |
| Mode M0 | |||
|---|---|---|---|
| Quadrant | BADHDUFLAG | Total packets | Discarded packets |
| A | 0 | 9584 | 0 |
| B | 0 | 9770 | 0 |
| C | 0 | 10064 | 0 |
| D | 0 | 23626 | 0 |
| Mode M9 | |||
|---|---|---|---|
| Quadrant | BADHDUFLAG | Total packets | Discarded packets |
| A | 0 | 11 | 0 |
| B | 0 | 11 | 0 |
| C | 0 | 11 | 0 |
| D | 0 | 11 | 0 |
| Quadrant | Total seconds | Saturated seconds | Saturation percentage |
|---|---|---|---|
| A | 4645 | 8 | 0.172228% |
| B | 4645 | 17 | 0.365985% |
| C | 4645 | 216 | 4.650161% |
| D | 4645 | 451 | 9.709365% |
Noise dominated data is calculated using 1-second bins in cleaned event files. If a bin has >2000 counts, and if more than 50% of those come from <1% of pixels, then it is considered to be noise-dominated and hence unusable.
| Quadrant | # 1 sec bins | Bins with >0 counts | Bins with >2000 counts | High rate bins dominated by noise | Noise dominated (total time) | Noise dominated (detector-on time) | Marked lightcurve |
|---|---|---|---|---|---|---|---|
| A | 5780 | 4645 | 0 | 0 | 0.00% | 0.00% |  |
| B | 5780 | 4645 | 0 | 0 | 0.00% | 0.00% | 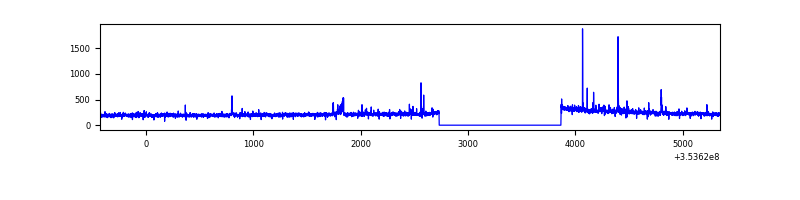 |
| C | 5780 | 4645 | 0 | 0 | 0.00% | 0.00% |  |
| D | 5780 | 4645 | 80 | 80 | 1.38% | 1.72% |  |
Top three noisy pixels from each quadrant. If the there are fewer than three noisy pixels in the level2.evt file, extra rows are filled as -1
| Pixel properties | Quadrant properties | ||||||
|---|---|---|---|---|---|---|---|
| Quadrant | DetID | PixID | Counts | Sigma | Mean | Median | Sigma |
| A | 0 | 13 | 14321 | 242.92 | 256 | 251 | 57.9 |
| A | 13 | 254 | 9060 | 152.09 | 256 | 251 | 57.9 |
| A | 8 | 192 | 3846 | 62.07 | 256 | 251 | 57.9 |
| B | 0 | 230 | 10198 | 192.31 | 260 | 254 | 51.7 |
| B | 0 | 190 | 8577 | 160.96 | 260 | 254 | 51.7 |
| B | 0 | 189 | 7451 | 139.18 | 260 | 254 | 51.7 |
| C | 3 | 233 | 48565 | 818.7 | 240 | 239 | 59.0 |
| C | 14 | 254 | 27972 | 469.83 | 240 | 239 | 59.0 |
| C | 2 | 114 | 8758 | 144.32 | 240 | 239 | 59.0 |
| D | 8 | 195 | 4384924 | 77766.38 | 239 | 231 | 56.4 |
| D | 13 | 153 | 44013 | 776.51 | 239 | 231 | 56.4 |
| D | 7 | 80 | 36443 | 642.25 | 239 | 231 | 56.4 |
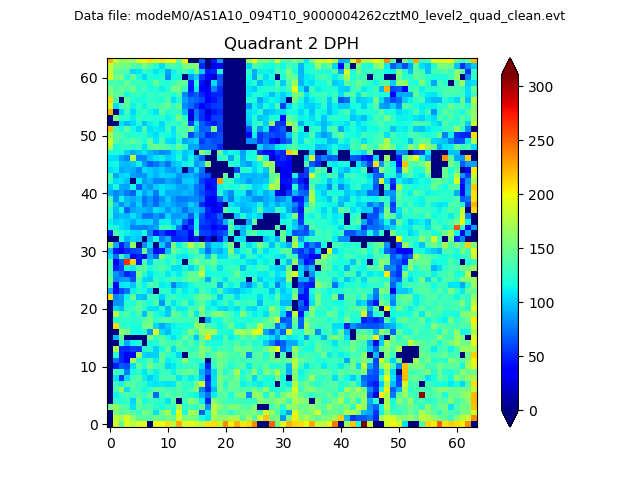
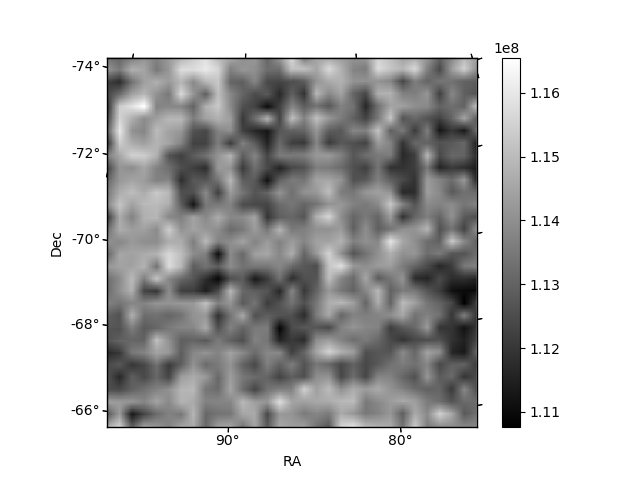
Histogram calculated using DETX and DETY for each event in the final _common_clean file
| Quadrant A |  |
 |
Quadrant B |
|---|---|---|---|
| Quadrant D |  |
 |
Quadrant C |
| Plot type | Count rate plots | Images |
|---|---|---|
| Comparison with Poisson distribution Blue bars denote a histogram of data divided into 1 sec bins. Red curve is a Poisson curve with rate = median count rate of data. |
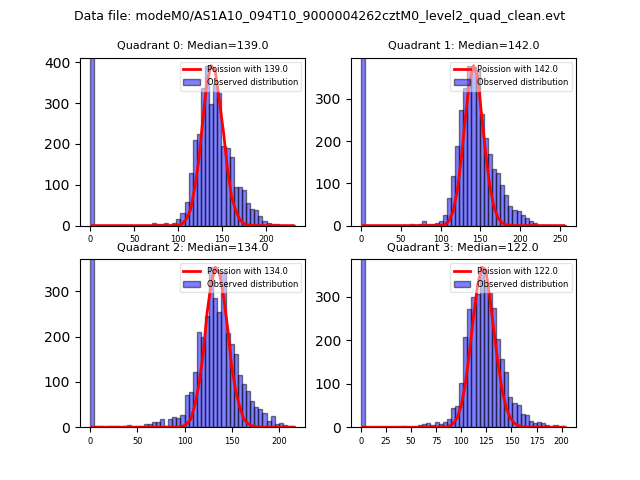 |
 |
| Quadrant-wise count rates Data is divided into 100 sec bins |
 |
|
| Module-wise count rates for Quadrant A Data is divided into 100 sec bins |
 |
 |
| Module-wise count rates for Quadrant B Data is divided into 100 sec bins |
 |
 |
| Module-wise count rates for Quadrant C Data is divided into 100 sec bins |
 |
 |
| Module-wise count rates for Quadrant D Data is divided into 100 sec bins |
 |
 |
| Parameter | Plot |
|---|---|
| CZT HV Monitor | 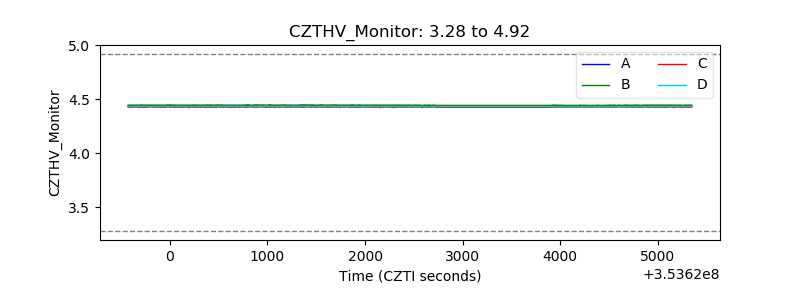 |
| D_VDD |  |
| Temperature 1 |  |
| Veto HV Monitor |  |
| Veto LLD | 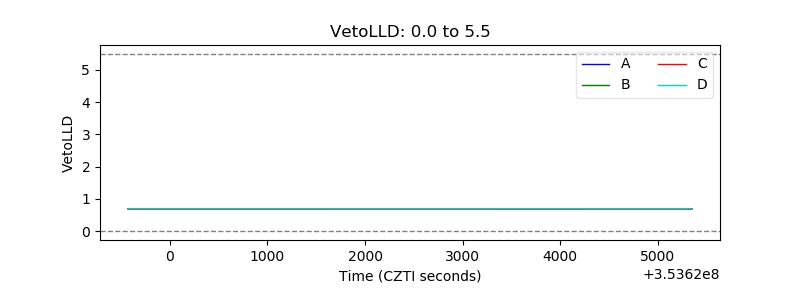 |
| Alpha Counter |  |
| _CPM_Rate |  |
| CZT Counter |  |
| +2.5 Volts monitor | 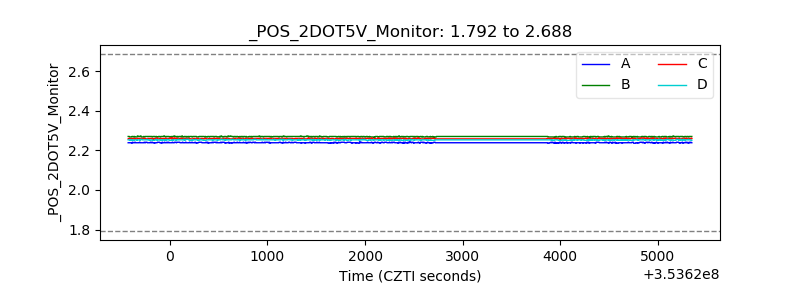 |
| +5 Volts monitor | 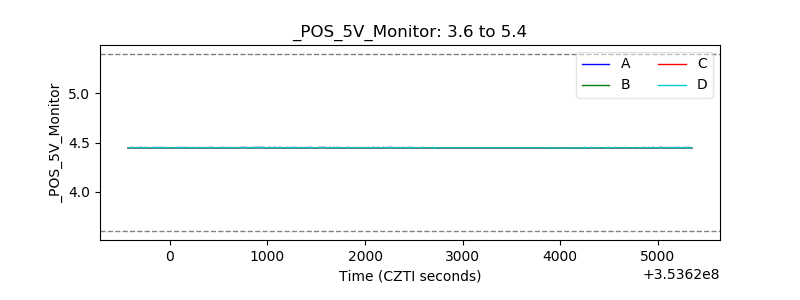 |
| _ROLL_ROT |  |
| _Roll_DEC |  |
| _Roll_RA |  |
| Veto Counter |  |