| Param | Original file | Final file |
|---|---|---|
| Filename | modeM0/AS1A13_068T07_9000006222cztM0_level2.fits | modeM0/AS1A13_068T07_9000006222cztM0_level2_quad_clean.evt |
| Size (bytes) | 830,194,560 | 891,005,760 |
| Size | 791.7 MB | 849.7 MB |
| Events in quadrant A | 4,877,116 | 5,382,319 |
| Events in quadrant B | 4,769,304 | 5,518,175 |
| Events in quadrant C | 4,806,616 | 4,990,971 |
| Events in quadrant D | 4,179,680 | 4,590,778 |
| Mode SS | |||
|---|---|---|---|
| Quadrant | BADHDUFLAG | Total packets | Discarded packets |
| A | 0 | 1922 | 0 |
| B | 0 | 1922 | 0 |
| C | 0 | 1922 | 0 |
| D | 0 | 1922 | 0 |
| Mode M0 | |||
|---|---|---|---|
| Quadrant | BADHDUFLAG | Total packets | Discarded packets |
| A | 0 | 343307 | 0 |
| B | 0 | 224678 | 0 |
| C | 0 | 246055 | 0 |
| D | 0 | 250962 | 0 |
| Mode M9 | |||
|---|---|---|---|
| Quadrant | BADHDUFLAG | Total packets | Discarded packets |
| A | 0 | 92 | 0 |
| B | 0 | 92 | 0 |
| C | 0 | 92 | 0 |
| D | 0 | 92 | 0 |
| Quadrant | Total seconds | Saturated seconds | Saturation percentage |
|---|---|---|---|
| A | 94844 | 4262 | 4.493695% |
| B | 94856 | 3064 | 3.230159% |
| C | 94844 | 6416 | 6.764793% |
| D | 94856 | 4605 | 4.854727% |
Noise dominated data is calculated using 1-second bins in cleaned event files. If a bin has >2000 counts, and if more than 50% of those come from <1% of pixels, then it is considered to be noise-dominated and hence unusable.
| Quadrant | # 1 sec bins | Bins with >0 counts | Bins with >2000 counts | High rate bins dominated by noise | Noise dominated (total time) | Noise dominated (detector-on time) | Marked lightcurve |
|---|---|---|---|---|---|---|---|
| A | 104244 | 94849 | 0 | 0 | 0.00% | 0.00% |  |
| B | 104243 | 94844 | 0 | 0 | 0.00% | 0.00% |  |
| C | 104244 | 94541 | 0 | 0 | 0.00% | 0.00% |  |
| D | 104244 | 94391 | 0 | 0 | 0.00% | 0.00% |  |
Top three noisy pixels from each quadrant. If the there are fewer than three noisy pixels in the level2.evt file, extra rows are filled as -1
| Pixel properties | Quadrant properties | ||||||
|---|---|---|---|---|---|---|---|
| Quadrant | DetID | PixID | Counts | Sigma | Mean | Median | Sigma |
| A | 7 | 110 | 4005 | 8.72 | 1272 | 1185 | 323.4 |
| A | 0 | 29 | 3809 | 8.11 | 1272 | 1185 | 323.4 |
| A | 0 | 30 | 3663 | 7.66 | 1272 | 1185 | 323.4 |
| B | 2 | 9 | 4514 | 13.29 | 1267 | 1204 | 249.0 |
| B | 2 | 8 | 3591 | 9.59 | 1267 | 1204 | 249.0 |
| B | 3 | 17 | 3404 | 8.84 | 1267 | 1204 | 249.0 |
| C | 3 | 202 | 3672 | 7.6 | 1271 | 1177 | 328.3 |
| C | 1 | 81 | 3636 | 7.49 | 1271 | 1177 | 328.3 |
| C | 1 | 80 | 3537 | 7.19 | 1271 | 1177 | 328.3 |
| D | 15 | 47 | 3097 | 6.05 | 1203 | 1091 | 331.8 |
| D | 12 | 6 | 3090 | 6.02 | 1203 | 1091 | 331.8 |
| D | 4 | 16 | 3057 | 5.92 | 1203 | 1091 | 331.8 |
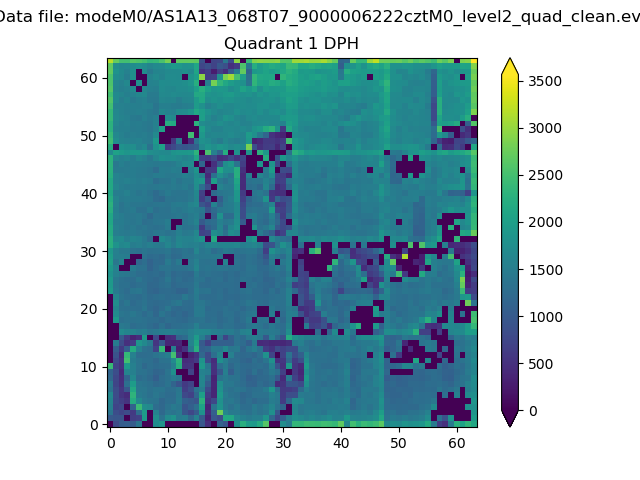
Histogram calculated using DETX and DETY for each event in the final _common_clean file
| Quadrant A |  |
 |
Quadrant B |
|---|---|---|---|
| Quadrant D |  |
 |
Quadrant C |
| Plot type | Count rate plots | Images |
|---|---|---|
| Comparison with Poisson distribution Blue bars denote a histogram of data divided into 1 sec bins. Red curve is a Poisson curve with rate = median count rate of data. |
 |
 |
| Quadrant-wise count rates Data is divided into 100 sec bins |
 |
|
| Module-wise count rates for Quadrant A Data is divided into 100 sec bins |
 |
 |
| Module-wise count rates for Quadrant B Data is divided into 100 sec bins |
 |
 |
| Module-wise count rates for Quadrant C Data is divided into 100 sec bins |
 |
 |
| Module-wise count rates for Quadrant D Data is divided into 100 sec bins |
 |
 |
| Parameter | Plot |
|---|---|
| CZT HV Monitor |  |
| D_VDD |  |
| Temperature 1 |  |
| Veto HV Monitor |  |
| Veto LLD |  |
| Alpha Counter | 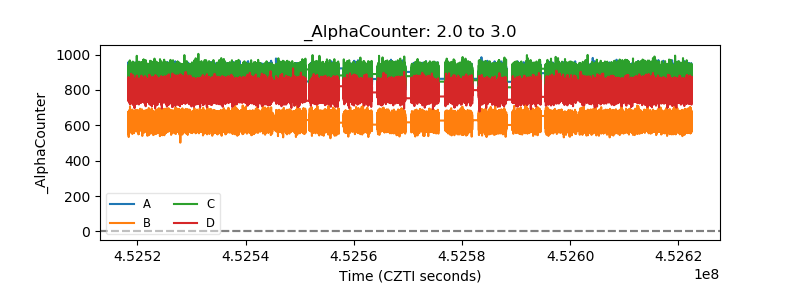 |
| _CPM_Rate |  |
| CZT Counter |  |
| +2.5 Volts monitor |  |
| +5 Volts monitor |  |
| _ROLL_ROT | 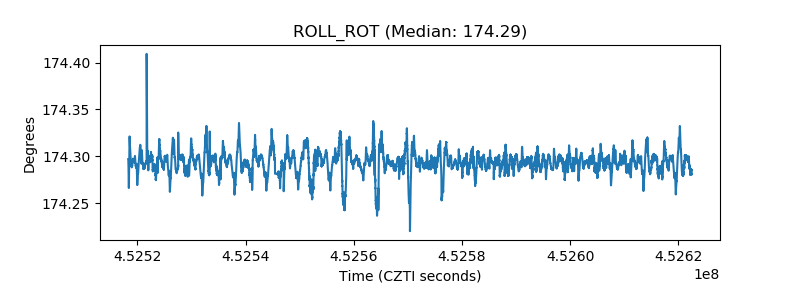 |
| _Roll_DEC |  |
| _Roll_RA |  |
| Veto Counter |  |