| Param | Original file | Final file |
|---|---|---|
| Filename | modeM0/AS1A13_068T06_9000006220cztM0_level2.fits | modeM0/AS1A13_068T06_9000006220cztM0_level2_quad_clean.evt |
| Size (bytes) | 492,367,680 | 429,091,200 |
| Size | 469.6 MB | 409.2 MB |
| Events in quadrant A | 2,918,298 | 2,401,696 |
| Events in quadrant B | 2,854,314 | 2,447,557 |
| Events in quadrant C | 2,959,192 | 2,345,439 |
| Events in quadrant D | 2,418,562 | 2,041,028 |
| Mode SS | |||
|---|---|---|---|
| Quadrant | BADHDUFLAG | Total packets | Discarded packets |
| A | 0 | 1118 | 0 |
| B | 0 | 1118 | 0 |
| C | 0 | 1118 | 0 |
| D | 0 | 1118 | 0 |
| Mode M0 | |||
|---|---|---|---|
| Quadrant | BADHDUFLAG | Total packets | Discarded packets |
| A | 0 | 179932 | 0 |
| B | 0 | 123076 | 0 |
| C | 0 | 115174 | 0 |
| D | 0 | 164368 | 0 |
| Mode M9 | |||
|---|---|---|---|
| Quadrant | BADHDUFLAG | Total packets | Discarded packets |
| A | 0 | 91 | 0 |
| B | 0 | 91 | 0 |
| C | 0 | 91 | 0 |
| D | 0 | 91 | 0 |
| Quadrant | Total seconds | Saturated seconds | Saturation percentage |
|---|---|---|---|
| A | 54769 | 1572 | 2.870237% |
| B | 54769 | 1397 | 2.550713% |
| C | 54769 | 417 | 0.761380% |
| D | 54769 | 4629 | 8.451861% |
Noise dominated data is calculated using 1-second bins in cleaned event files. If a bin has >2000 counts, and if more than 50% of those come from <1% of pixels, then it is considered to be noise-dominated and hence unusable.
| Quadrant | # 1 sec bins | Bins with >0 counts | Bins with >2000 counts | High rate bins dominated by noise | Noise dominated (total time) | Noise dominated (detector-on time) | Marked lightcurve |
|---|---|---|---|---|---|---|---|
| A | 63959 | 54763 | 0 | 0 | 0.00% | 0.00% |  |
| B | 63959 | 54753 | 0 | 0 | 0.00% | 0.00% |  |
| C | 63959 | 54764 | 0 | 0 | 0.00% | 0.00% |  |
| D | 63959 | 54677 | 0 | 0 | 0.00% | 0.00% |  |
Top three noisy pixels from each quadrant. If the there are fewer than three noisy pixels in the level2.evt file, extra rows are filled as -1
| Pixel properties | Quadrant properties | ||||||
|---|---|---|---|---|---|---|---|
| Quadrant | DetID | PixID | Counts | Sigma | Mean | Median | Sigma |
| A | 7 | 110 | 2386 | 8.52 | 761 | 708 | 196.9 |
| A | 0 | 29 | 2333 | 8.25 | 761 | 708 | 196.9 |
| A | 14 | 95 | 2232 | 7.74 | 761 | 708 | 196.9 |
| B | 2 | 9 | 2636 | 12.9 | 752 | 714 | 148.9 |
| B | 2 | 8 | 2151 | 9.65 | 752 | 714 | 148.9 |
| B | 3 | 17 | 2125 | 9.47 | 752 | 714 | 148.9 |
| C | 3 | 202 | 2311 | 7.71 | 783 | 725 | 205.8 |
| C | 1 | 81 | 2217 | 7.25 | 783 | 725 | 205.8 |
| C | 3 | 203 | 2187 | 7.1 | 783 | 725 | 205.8 |
| D | 6 | 67 | 1785 | 6.03 | 695 | 630 | 191.5 |
| D | 10 | 189 | 1746 | 5.82 | 695 | 630 | 191.5 |
| D | 15 | 63 | 1710 | 5.64 | 695 | 630 | 191.5 |
Histogram calculated using DETX and DETY for each event in the final _common_clean file
| Quadrant A |  |
 |
Quadrant B |
|---|---|---|---|
| Quadrant D |  |
 |
Quadrant C |
| Plot type | Count rate plots | Images |
|---|---|---|
| Comparison with Poisson distribution Blue bars denote a histogram of data divided into 1 sec bins. Red curve is a Poisson curve with rate = median count rate of data. |
 |
 |
| Quadrant-wise count rates Data is divided into 100 sec bins |
 |
|
| Module-wise count rates for Quadrant A Data is divided into 100 sec bins |
 |
 |
| Module-wise count rates for Quadrant B Data is divided into 100 sec bins |
 |
 |
| Module-wise count rates for Quadrant C Data is divided into 100 sec bins |
 |
 |
| Module-wise count rates for Quadrant D Data is divided into 100 sec bins |
 |
 |
| Parameter | Plot |
|---|---|
| CZT HV Monitor |  |
| D_VDD |  |
| Temperature 1 |  |
| Veto HV Monitor |  |
| Veto LLD |  |
| Alpha Counter |  |
| _CPM_Rate |  |
| CZT Counter | 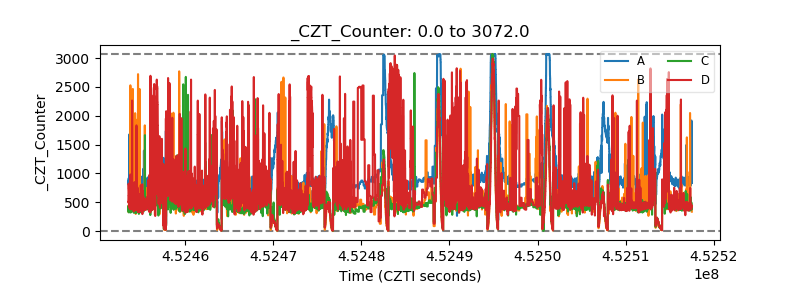 |
| +2.5 Volts monitor |  |
| +5 Volts monitor |  |
| _ROLL_ROT |  |
| _Roll_DEC |  |
| _Roll_RA | 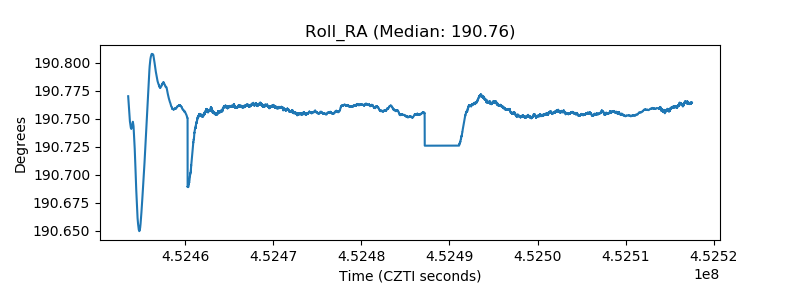 |
| Veto Counter |  |