| Param | Original file | Final file |
|---|---|---|
| Filename | modeM0/AS1A13_037T05_9000006216cztM0_level2.fits | modeM0/AS1A13_037T05_9000006216cztM0_level2_quad_clean.evt |
| Size (bytes) | 542,926,080 | 513,072,000 |
| Size | 517.8 MB | 489.3 MB |
| Events in quadrant A | 3,192,056 | 3,001,854 |
| Events in quadrant B | 2,975,366 | 2,742,895 |
| Events in quadrant C | 3,298,046 | 2,965,612 |
| Events in quadrant D | 2,769,396 | 2,624,687 |
| Mode M0 | |||
|---|---|---|---|
| Quadrant | BADHDUFLAG | Total packets | Discarded packets |
| A | 0 | 206685 | 0 |
| B | 0 | 191822 | 0 |
| C | 0 | 126793 | 0 |
| D | 0 | 166487 | 0 |
| Mode SS | |||
|---|---|---|---|
| Quadrant | BADHDUFLAG | Total packets | Discarded packets |
| A | 0 | 1242 | 0 |
| B | 0 | 1242 | 0 |
| C | 0 | 1242 | 0 |
| D | 0 | 1242 | 0 |
| Mode M9 | |||
|---|---|---|---|
| Quadrant | BADHDUFLAG | Total packets | Discarded packets |
| A | 0 | 58 | 0 |
| B | 0 | 58 | 0 |
| C | 0 | 58 | 0 |
| D | 0 | 58 | 0 |
| Quadrant | Total seconds | Saturated seconds | Saturation percentage |
|---|---|---|---|
| A | 61265 | 1955 | 3.191055% |
| B | 61265 | 8349 | 13.627683% |
| C | 61265 | 306 | 0.499470% |
| D | 61265 | 2178 | 3.555048% |
Noise dominated data is calculated using 1-second bins in cleaned event files. If a bin has >2000 counts, and if more than 50% of those come from <1% of pixels, then it is considered to be noise-dominated and hence unusable.
| Quadrant | # 1 sec bins | Bins with >0 counts | Bins with >2000 counts | High rate bins dominated by noise | Noise dominated (total time) | Noise dominated (detector-on time) | Marked lightcurve |
|---|---|---|---|---|---|---|---|
| A | 66775 | 61262 | 0 | 0 | 0.00% | 0.00% |  |
| B | 66775 | 61237 | 0 | 0 | 0.00% | 0.00% |  |
| C | 66774 | 61264 | 0 | 0 | 0.00% | 0.00% | 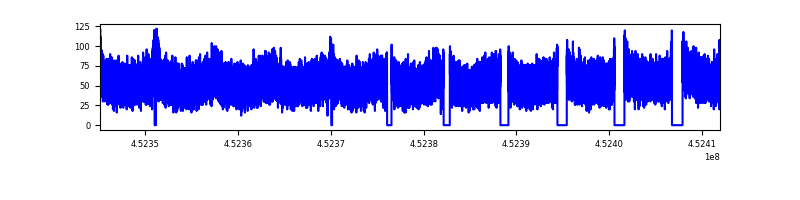 |
| D | 66774 | 61247 | 0 | 0 | 0.00% | 0.00% |  |
Top three noisy pixels from each quadrant. If the there are fewer than three noisy pixels in the level2.evt file, extra rows are filled as -1
| Pixel properties | Quadrant properties | ||||||
|---|---|---|---|---|---|---|---|
| Quadrant | DetID | PixID | Counts | Sigma | Mean | Median | Sigma |
| A | 7 | 110 | 2694 | 8.98 | 832 | 773 | 214.0 |
| A | 14 | 95 | 2468 | 7.92 | 832 | 773 | 214.0 |
| A | 0 | 29 | 2416 | 7.68 | 832 | 773 | 214.0 |
| B | 2 | 9 | 2836 | 13.51 | 783 | 744 | 154.9 |
| B | 2 | 8 | 2272 | 9.87 | 783 | 744 | 154.9 |
| B | 3 | 17 | 2164 | 9.17 | 783 | 744 | 154.9 |
| C | 3 | 202 | 2585 | 7.87 | 871 | 810 | 225.5 |
| C | 1 | 81 | 2487 | 7.44 | 871 | 810 | 225.5 |
| C | 3 | 203 | 2463 | 7.33 | 871 | 810 | 225.5 |
| D | 10 | 189 | 2061 | 6.21 | 794 | 720 | 216.1 |
| D | 12 | 6 | 2032 | 6.07 | 794 | 720 | 216.1 |
| D | 15 | 47 | 2008 | 5.96 | 794 | 720 | 216.1 |
Histogram calculated using DETX and DETY for each event in the final _common_clean file
| Quadrant A | 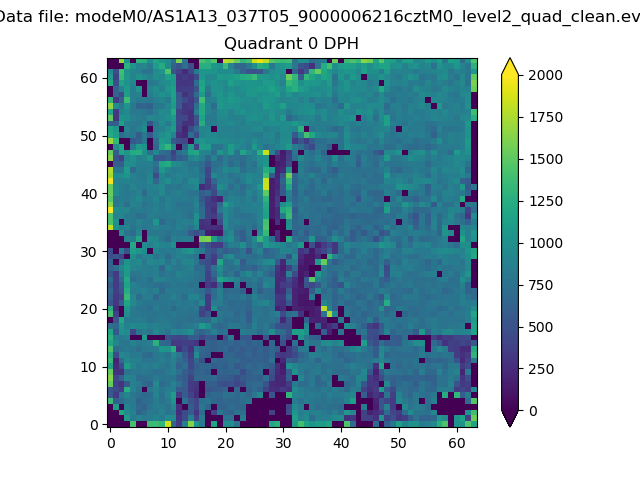 |
 |
Quadrant B |
|---|---|---|---|
| Quadrant D |  |
 |
Quadrant C |
| Plot type | Count rate plots | Images |
|---|---|---|
| Comparison with Poisson distribution Blue bars denote a histogram of data divided into 1 sec bins. Red curve is a Poisson curve with rate = median count rate of data. |
 |
 |
| Quadrant-wise count rates Data is divided into 100 sec bins |
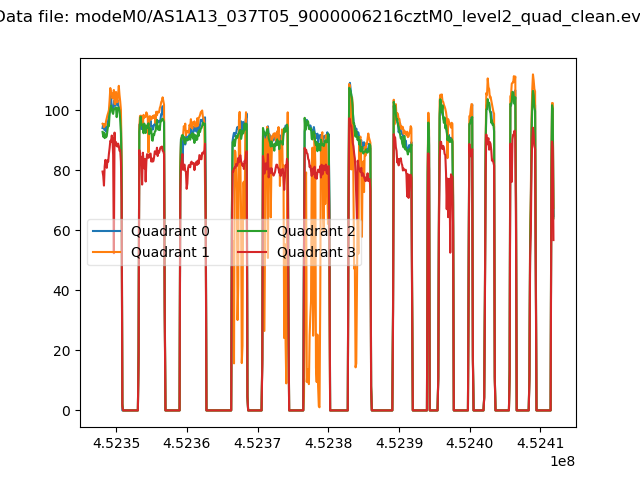 |
|
| Module-wise count rates for Quadrant A Data is divided into 100 sec bins |
 |
 |
| Module-wise count rates for Quadrant B Data is divided into 100 sec bins |
 |
 |
| Module-wise count rates for Quadrant C Data is divided into 100 sec bins |
 |
 |
| Module-wise count rates for Quadrant D Data is divided into 100 sec bins |
 |
 |
| Parameter | Plot |
|---|---|
| CZT HV Monitor | 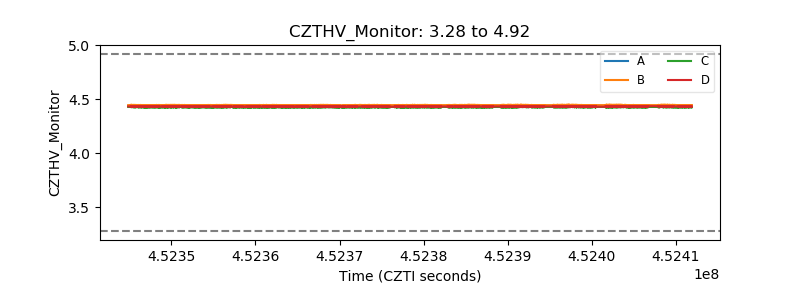 |
| D_VDD | 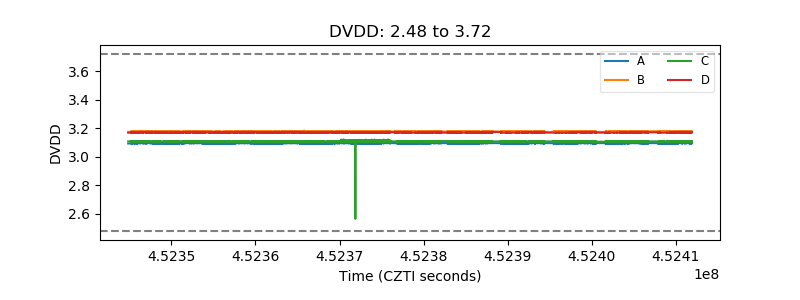 |
| Temperature 1 |  |
| Veto HV Monitor |  |
| Veto LLD | 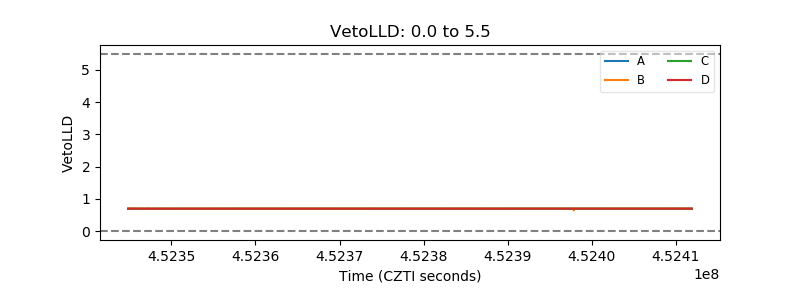 |
| Alpha Counter |  |
| _CPM_Rate |  |
| CZT Counter |  |
| +2.5 Volts monitor |  |
| +5 Volts monitor |  |
| _ROLL_ROT |  |
| _Roll_DEC | 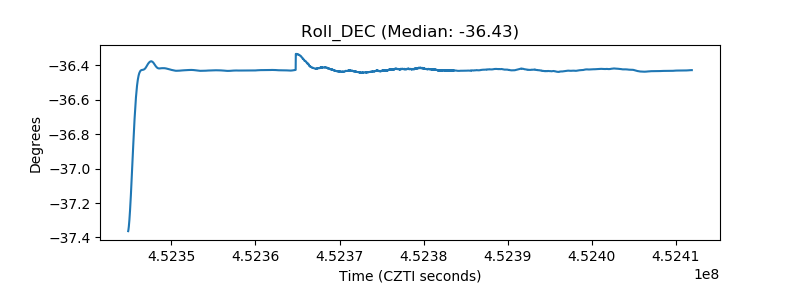 |
| _Roll_RA |  |
| Veto Counter |  |