| Param | Original file | Final file |
|---|---|---|
| Filename | modeM0/AS1T05_203T01_9000006214cztM0_level2.fits | modeM0/AS1T05_203T01_9000006214cztM0_level2_quad_clean.evt |
| Size (bytes) | 535,654,080 | 510,848,640 |
| Size | 510.8 MB | 487.2 MB |
| Events in quadrant A | 3,130,146 | 2,905,107 |
| Events in quadrant B | 3,109,616 | 3,052,808 |
| Events in quadrant C | 3,212,566 | 2,911,373 |
| Events in quadrant D | 2,675,890 | 2,509,777 |
| Mode SS | |||
|---|---|---|---|
| Quadrant | BADHDUFLAG | Total packets | Discarded packets |
| A | 0 | 1214 | 0 |
| B | 0 | 1214 | 0 |
| C | 0 | 1214 | 0 |
| D | 0 | 1214 | 0 |
| Mode M9 | |||
|---|---|---|---|
| Quadrant | BADHDUFLAG | Total packets | Discarded packets |
| A | 0 | 84 | 0 |
| B | 0 | 84 | 0 |
| C | 0 | 84 | 0 |
| D | 0 | 84 | 0 |
| Mode M0 | |||
|---|---|---|---|
| Quadrant | BADHDUFLAG | Total packets | Discarded packets |
| A | 0 | 213974 | 0 |
| B | 0 | 131782 | 0 |
| C | 0 | 126411 | 0 |
| D | 0 | 171621 | 0 |
| Quadrant | Total seconds | Saturated seconds | Saturation percentage |
|---|---|---|---|
| A | 59632 | 2601 | 4.361752% |
| B | 59632 | 1347 | 2.258854% |
| C | 59632 | 548 | 0.918970% |
| D | 59632 | 3529 | 5.917964% |
Noise dominated data is calculated using 1-second bins in cleaned event files. If a bin has >2000 counts, and if more than 50% of those come from <1% of pixels, then it is considered to be noise-dominated and hence unusable.
| Quadrant | # 1 sec bins | Bins with >0 counts | Bins with >2000 counts | High rate bins dominated by noise | Noise dominated (total time) | Noise dominated (detector-on time) | Marked lightcurve |
|---|---|---|---|---|---|---|---|
| A | 68137 | 59626 | 0 | 0 | 0.00% | 0.00% |  |
| B | 68137 | 59627 | 0 | 0 | 0.00% | 0.00% | 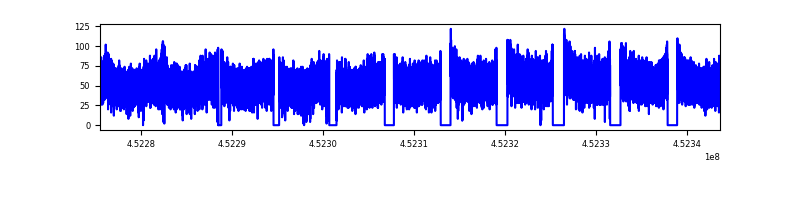 |
| C | 68137 | 59630 | 0 | 0 | 0.00% | 0.00% | 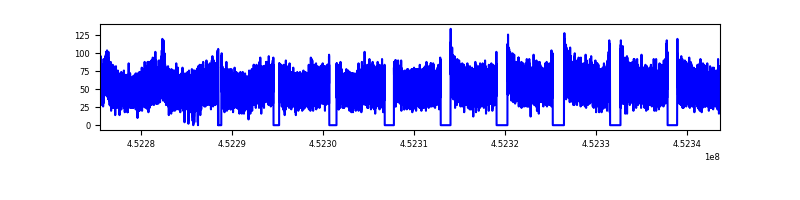 |
| D | 68137 | 59575 | 0 | 0 | 0.00% | 0.00% |  |
Top three noisy pixels from each quadrant. If the there are fewer than three noisy pixels in the level2.evt file, extra rows are filled as -1
| Pixel properties | Quadrant properties | ||||||
|---|---|---|---|---|---|---|---|
| Quadrant | DetID | PixID | Counts | Sigma | Mean | Median | Sigma |
| A | 7 | 110 | 2507 | 8.28 | 817 | 763 | 210.6 |
| A | 0 | 29 | 2419 | 7.86 | 817 | 763 | 210.6 |
| A | 14 | 95 | 2383 | 7.69 | 817 | 763 | 210.6 |
| B | 2 | 9 | 3008 | 13.58 | 821 | 781 | 164.0 |
| B | 2 | 8 | 2388 | 9.8 | 821 | 781 | 164.0 |
| B | 3 | 17 | 2155 | 8.38 | 821 | 781 | 164.0 |
| C | 1 | 81 | 2402 | 7.34 | 849 | 789 | 219.6 |
| C | 1 | 80 | 2334 | 7.03 | 849 | 789 | 219.6 |
| C | 3 | 202 | 2327 | 7.0 | 849 | 789 | 219.6 |
| D | 10 | 189 | 1963 | 6.05 | 769 | 701 | 208.5 |
| D | 15 | 47 | 1924 | 5.87 | 769 | 701 | 208.5 |
| D | 6 | 38 | 1893 | 5.72 | 769 | 701 | 208.5 |
Histogram calculated using DETX and DETY for each event in the final _common_clean file
| Quadrant A |  |
 |
Quadrant B |
|---|---|---|---|
| Quadrant D | 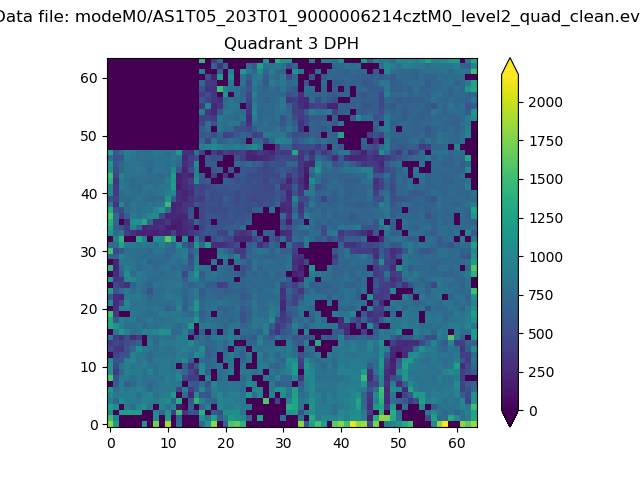 |
 |
Quadrant C |
| Plot type | Count rate plots | Images |
|---|---|---|
| Comparison with Poisson distribution Blue bars denote a histogram of data divided into 1 sec bins. Red curve is a Poisson curve with rate = median count rate of data. |
 |
 |
| Quadrant-wise count rates Data is divided into 100 sec bins |
 |
|
| Module-wise count rates for Quadrant A Data is divided into 100 sec bins |
 |
 |
| Module-wise count rates for Quadrant B Data is divided into 100 sec bins |
 |
 |
| Module-wise count rates for Quadrant C Data is divided into 100 sec bins |
 |
 |
| Module-wise count rates for Quadrant D Data is divided into 100 sec bins |
 |
 |
| Parameter | Plot |
|---|---|
| CZT HV Monitor | 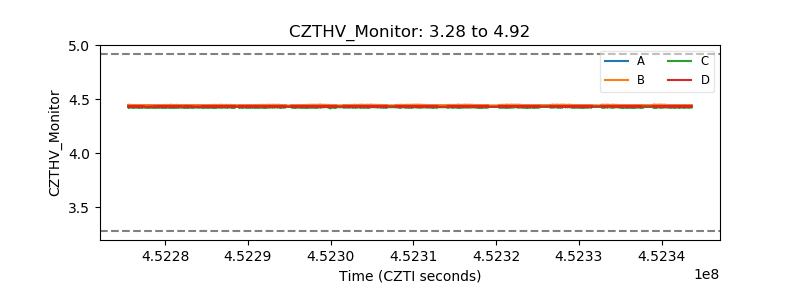 |
| D_VDD |  |
| Temperature 1 |  |
| Veto HV Monitor |  |
| Veto LLD |  |
| Alpha Counter |  |
| _CPM_Rate |  |
| CZT Counter |  |
| +2.5 Volts monitor |  |
| +5 Volts monitor |  |
| _ROLL_ROT |  |
| _Roll_DEC |  |
| _Roll_RA | 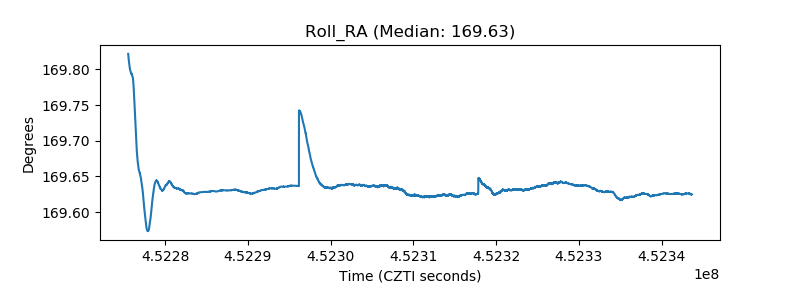 |
| Veto Counter | 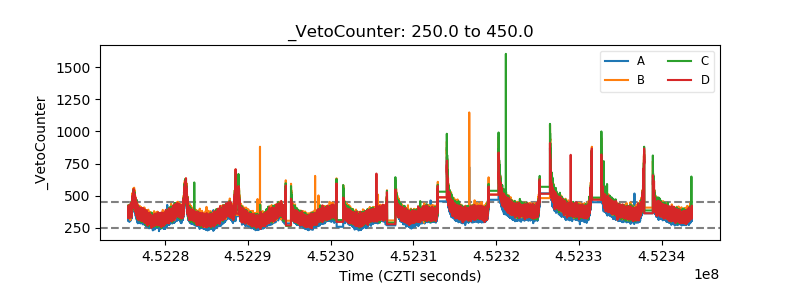 |