| Param | Original file | Final file |
|---|---|---|
| Filename | modeM0/AS1A13_070T04_9000006204cztM0_level2.fits | modeM0/AS1A13_070T04_9000006204cztM0_level2_quad_clean.evt |
| Size (bytes) | 1,060,496,640 | 1,232,216,640 |
| Size | 1011.4 MB | 1.1 GB |
| Events in quadrant A | 6,180,192 | 7,483,708 |
| Events in quadrant B | 6,067,266 | 7,763,143 |
| Events in quadrant C | 6,191,416 | 7,223,232 |
| Events in quadrant D | 5,382,294 | 6,559,444 |
| Mode SS | |||
|---|---|---|---|
| Quadrant | BADHDUFLAG | Total packets | Discarded packets |
| A | 0 | 2450 | 0 |
| B | 0 | 2450 | 0 |
| C | 0 | 2450 | 0 |
| D | 0 | 2450 | 0 |
| Mode M9 | |||
|---|---|---|---|
| Quadrant | BADHDUFLAG | Total packets | Discarded packets |
| A | 0 | 119 | 0 |
| B | 0 | 119 | 0 |
| C | 0 | 119 | 0 |
| D | 0 | 119 | 0 |
| Mode M0 | |||
|---|---|---|---|
| Quadrant | BADHDUFLAG | Total packets | Discarded packets |
| A | 0 | 416033 | 0 |
| B | 0 | 272483 | 0 |
| C | 0 | 277259 | 0 |
| D | 0 | 293273 | 0 |
| Quadrant | Total seconds | Saturated seconds | Saturation percentage |
|---|---|---|---|
| A | 120989 | 4478 | 3.701163% |
| B | 120991 | 2663 | 2.200990% |
| C | 120990 | 3618 | 2.990330% |
| D | 120992 | 3673 | 3.035738% |
Noise dominated data is calculated using 1-second bins in cleaned event files. If a bin has >2000 counts, and if more than 50% of those come from <1% of pixels, then it is considered to be noise-dominated and hence unusable.
| Quadrant | # 1 sec bins | Bins with >0 counts | Bins with >2000 counts | High rate bins dominated by noise | Noise dominated (total time) | Noise dominated (detector-on time) | Marked lightcurve |
|---|---|---|---|---|---|---|---|
| A | 132882 | 120989 | 0 | 0 | 0.00% | 0.00% |  |
| B | 132882 | 120969 | 0 | 0 | 0.00% | 0.00% | 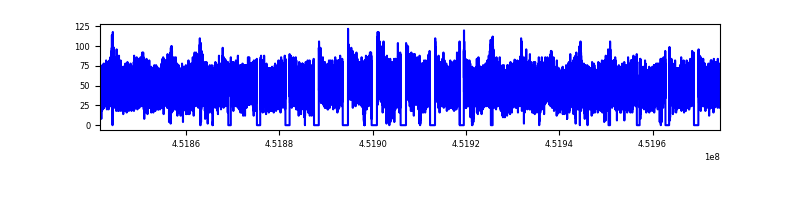 |
| C | 132882 | 120572 | 0 | 0 | 0.00% | 0.00% | 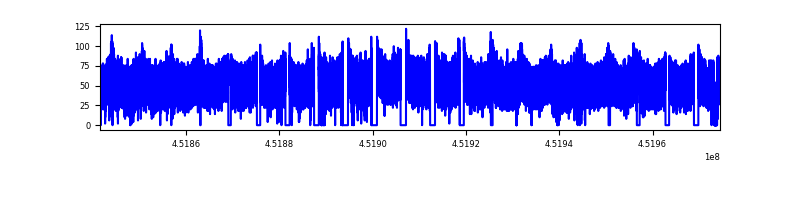 |
| D | 132882 | 120951 | 0 | 0 | 0.00% | 0.00% |  |
Top three noisy pixels from each quadrant. If the there are fewer than three noisy pixels in the level2.evt file, extra rows are filled as -1
| Pixel properties | Quadrant properties | ||||||
|---|---|---|---|---|---|---|---|
| Quadrant | DetID | PixID | Counts | Sigma | Mean | Median | Sigma |
| A | 7 | 110 | 5042 | 8.6 | 1614 | 1505 | 411.4 |
| A | 14 | 95 | 4712 | 7.79 | 1614 | 1505 | 411.4 |
| A | 0 | 29 | 4655 | 7.66 | 1614 | 1505 | 411.4 |
| B | 2 | 9 | 5883 | 14.07 | 1606 | 1531 | 309.3 |
| B | 2 | 8 | 4837 | 10.69 | 1606 | 1531 | 309.3 |
| B | 3 | 17 | 4545 | 9.75 | 1606 | 1531 | 309.3 |
| C | 1 | 81 | 4841 | 7.79 | 1638 | 1522 | 426.3 |
| C | 3 | 202 | 4783 | 7.65 | 1638 | 1522 | 426.3 |
| C | 3 | 203 | 4706 | 7.47 | 1638 | 1522 | 426.3 |
| D | 10 | 189 | 4009 | 6.05 | 1546 | 1402 | 430.8 |
| D | 15 | 63 | 3898 | 5.79 | 1546 | 1402 | 430.8 |
| D | 15 | 47 | 3851 | 5.68 | 1546 | 1402 | 430.8 |
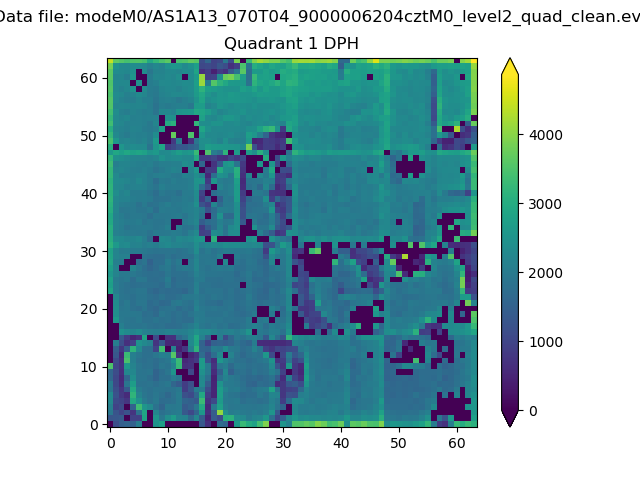
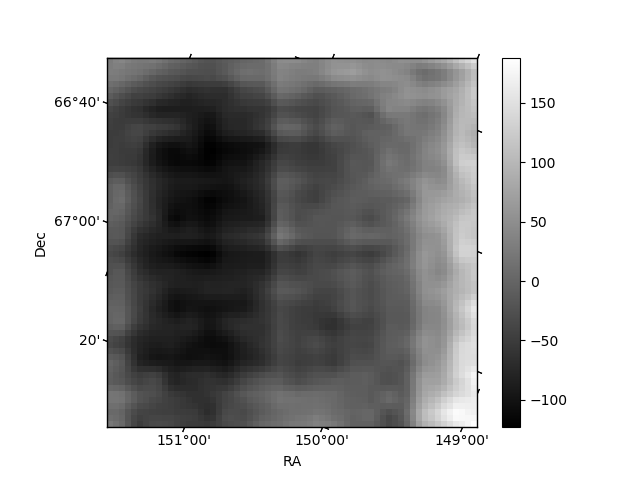
Histogram calculated using DETX and DETY for each event in the final _common_clean file
| Quadrant A |  |
 |
Quadrant B |
|---|---|---|---|
| Quadrant D |  |
 |
Quadrant C |
| Plot type | Count rate plots | Images |
|---|---|---|
| Comparison with Poisson distribution Blue bars denote a histogram of data divided into 1 sec bins. Red curve is a Poisson curve with rate = median count rate of data. |
 |
 |
| Quadrant-wise count rates Data is divided into 100 sec bins |
 |
|
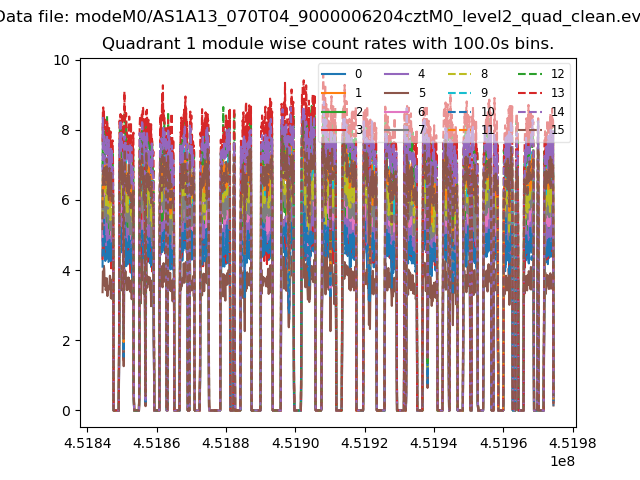
| Module-wise count rates for Quadrant A Data is divided into 100 sec bins |
 |
 |
| Module-wise count rates for Quadrant B Data is divided into 100 sec bins |
 |
 |
| Module-wise count rates for Quadrant C Data is divided into 100 sec bins |
 |
 |
| Module-wise count rates for Quadrant D Data is divided into 100 sec bins |
 |
 |
| Parameter | Plot |
|---|---|
| CZT HV Monitor | 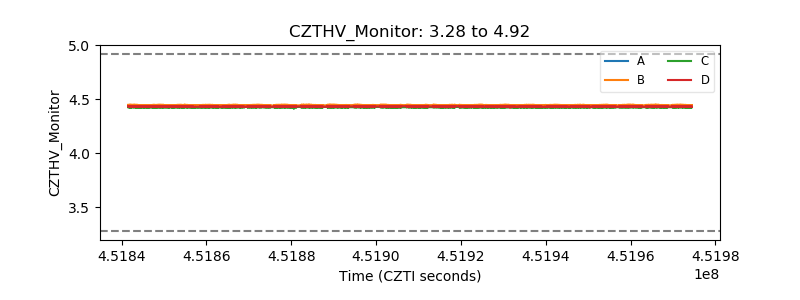 |
| D_VDD |  |
| Temperature 1 |  |
| Veto HV Monitor |  |
| Veto LLD |  |
| Alpha Counter | 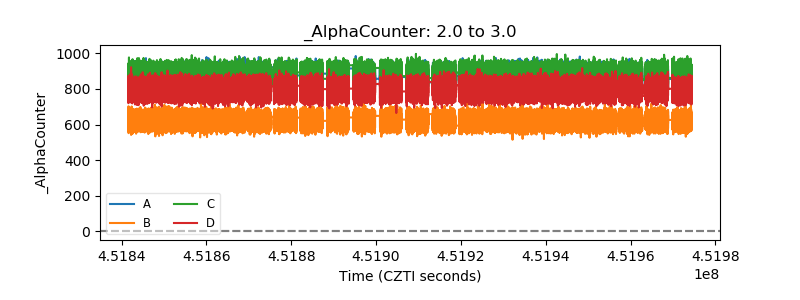 |
| _CPM_Rate |  |
| CZT Counter |  |
| +2.5 Volts monitor |  |
| +5 Volts monitor |  |
| _ROLL_ROT |  |
| _Roll_DEC |  |
| _Roll_RA |  |
| Veto Counter |  |