| Param | Original file | Final file |
|---|---|---|
| Filename | modeM0/AS1A13_068T02_9000006200cztM0_level2.fits | modeM0/AS1A13_068T02_9000006200cztM0_level2_quad_clean.evt |
| Size (bytes) | 554,664,960 | 580,996,800 |
| Size | 529.0 MB | 554.1 MB |
| Events in quadrant A | 3,253,014 | 3,484,237 |
| Events in quadrant B | 3,198,316 | 3,523,639 |
| Events in quadrant C | 3,274,648 | 3,357,496 |
| Events in quadrant D | 2,816,528 | 2,977,883 |
| Mode SS | |||
|---|---|---|---|
| Quadrant | BADHDUFLAG | Total packets | Discarded packets |
| A | 0 | 1260 | 0 |
| B | 0 | 1260 | 0 |
| C | 0 | 1260 | 0 |
| D | 0 | 1260 | 0 |
| Mode M0 | |||
|---|---|---|---|
| Quadrant | BADHDUFLAG | Total packets | Discarded packets |
| A | 0 | 209503 | 0 |
| B | 0 | 143176 | 0 |
| C | 0 | 150258 | 0 |
| D | 0 | 168646 | 0 |
| Mode M9 | |||
|---|---|---|---|
| Quadrant | BADHDUFLAG | Total packets | Discarded packets |
| A | 0 | 79 | 0 |
| B | 0 | 79 | 0 |
| C | 0 | 79 | 0 |
| D | 0 | 79 | 0 |
| Quadrant | Total seconds | Saturated seconds | Saturation percentage |
|---|---|---|---|
| A | 61986 | 2384 | 3.846030% |
| B | 61986 | 1762 | 2.842577% |
| C | 61986 | 1779 | 2.870003% |
| D | 61986 | 3186 | 5.139870% |
Noise dominated data is calculated using 1-second bins in cleaned event files. If a bin has >2000 counts, and if more than 50% of those come from <1% of pixels, then it is considered to be noise-dominated and hence unusable.
| Quadrant | # 1 sec bins | Bins with >0 counts | Bins with >2000 counts | High rate bins dominated by noise | Noise dominated (total time) | Noise dominated (detector-on time) | Marked lightcurve |
|---|---|---|---|---|---|---|---|
| A | 69966 | 61963 | 0 | 0 | 0.00% | 0.00% |  |
| B | 69966 | 61980 | 0 | 0 | 0.00% | 0.00% |  |
| C | 69966 | 61976 | 0 | 0 | 0.00% | 0.00% |  |
| D | 69966 | 61971 | 0 | 0 | 0.00% | 0.00% |  |
Top three noisy pixels from each quadrant. If the there are fewer than three noisy pixels in the level2.evt file, extra rows are filled as -1
| Pixel properties | Quadrant properties | ||||||
|---|---|---|---|---|---|---|---|
| Quadrant | DetID | PixID | Counts | Sigma | Mean | Median | Sigma |
| A | 7 | 110 | 2593 | 8.26 | 849 | 792 | 218.0 |
| A | 15 | 236 | 2578 | 8.19 | 849 | 792 | 218.0 |
| A | 0 | 29 | 2529 | 7.97 | 849 | 792 | 218.0 |
| B | 2 | 9 | 2944 | 12.73 | 842 | 797 | 168.7 |
| B | 2 | 8 | 2352 | 9.22 | 842 | 797 | 168.7 |
| B | 3 | 17 | 2291 | 8.86 | 842 | 797 | 168.7 |
| C | 3 | 202 | 2459 | 7.33 | 864 | 800 | 226.2 |
| C | 1 | 81 | 2421 | 7.17 | 864 | 800 | 226.2 |
| C | 3 | 203 | 2362 | 6.9 | 864 | 800 | 226.2 |
| D | 10 | 113 | 2058 | 5.92 | 807 | 734 | 223.7 |
| D | 4 | 250 | 2020 | 5.75 | 807 | 734 | 223.7 |
| D | 10 | 189 | 2014 | 5.72 | 807 | 734 | 223.7 |
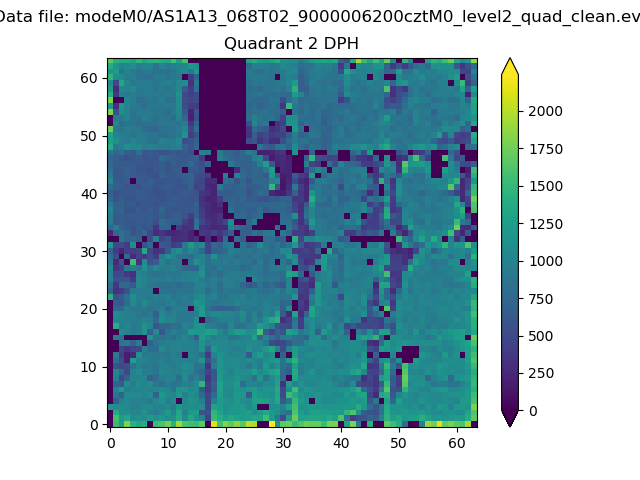
Histogram calculated using DETX and DETY for each event in the final _common_clean file
| Quadrant A |  |
 |
Quadrant B |
|---|---|---|---|
| Quadrant D |  |
 |
Quadrant C |
| Plot type | Count rate plots | Images |
|---|---|---|
| Comparison with Poisson distribution Blue bars denote a histogram of data divided into 1 sec bins. Red curve is a Poisson curve with rate = median count rate of data. |
 |
 |
| Quadrant-wise count rates Data is divided into 100 sec bins |
 |
|
| Module-wise count rates for Quadrant A Data is divided into 100 sec bins |
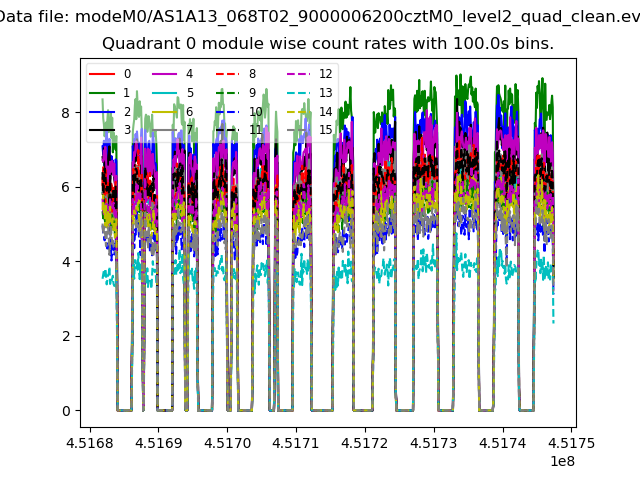 |
 |
| Module-wise count rates for Quadrant B Data is divided into 100 sec bins |
 |
 |
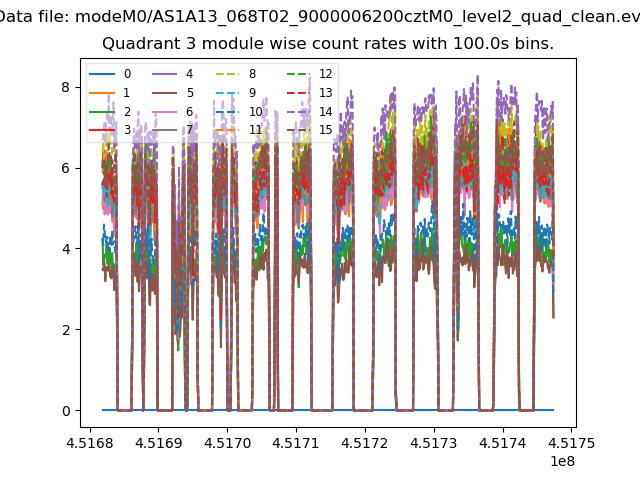
| Module-wise count rates for Quadrant C Data is divided into 100 sec bins |
 |
 |
| Module-wise count rates for Quadrant D Data is divided into 100 sec bins |
 |
 |
| Parameter | Plot |
|---|---|
| CZT HV Monitor | 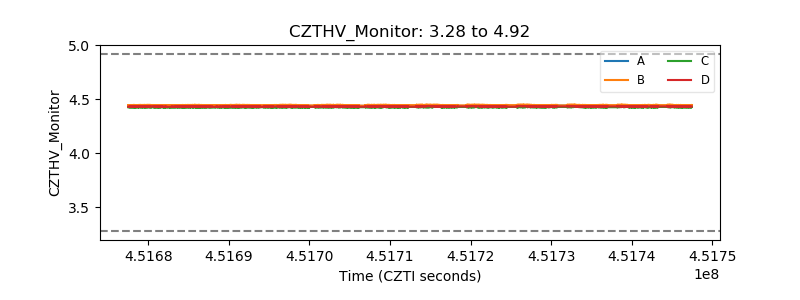 |
| D_VDD |  |
| Temperature 1 |  |
| Veto HV Monitor |  |
| Veto LLD |  |
| Alpha Counter |  |
| _CPM_Rate |  |
| CZT Counter |  |
| +2.5 Volts monitor |  |
| +5 Volts monitor |  |
| _ROLL_ROT | 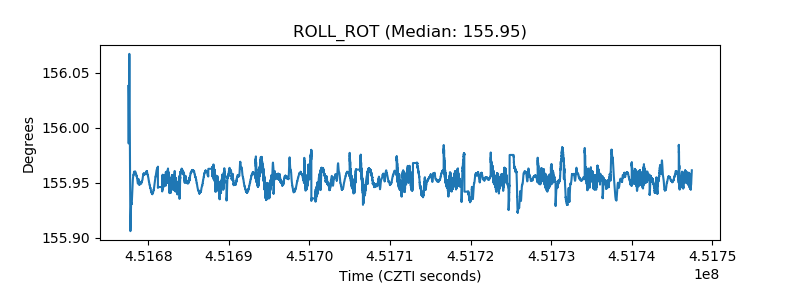 |
| _Roll_DEC |  |
| _Roll_RA | 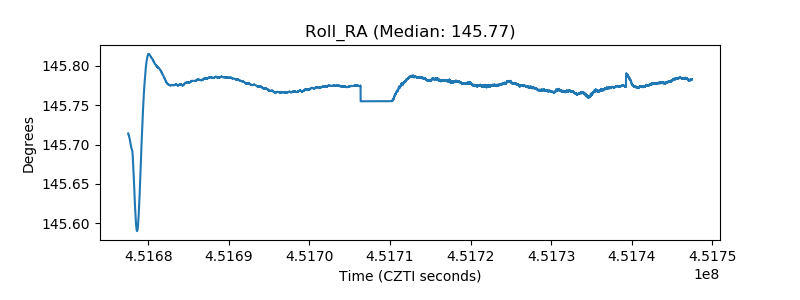 |
| Veto Counter |  |