| Param | Original file | Final file |
|---|---|---|
| Filename | modeM0/AS1A13_070T05_9000006198cztM0_level2.fits | modeM0/AS1A13_070T05_9000006198cztM0_level2_quad_clean.evt |
| Size (bytes) | 1,318,173,120 | 1,383,010,560 |
| Size | 1.2 GB | 1.3 GB |
| Events in quadrant A | 6,818,344 | 6,842,381 |
| Events in quadrant B | 7,710,928 | 8,826,352 |
| Events in quadrant C | 8,165,540 | 8,678,317 |
| Events in quadrant D | 6,589,298 | 6,932,728 |
| Mode M9 | |||
|---|---|---|---|
| Quadrant | BADHDUFLAG | Total packets | Discarded packets |
| A | 0 | 182 | 0 |
| B | 0 | 182 | 0 |
| C | 0 | 182 | 0 |
| D | 0 | 182 | 0 |
| Mode SS | |||
|---|---|---|---|
| Quadrant | BADHDUFLAG | Total packets | Discarded packets |
| A | 0 | 3142 | 0 |
| B | 0 | 3142 | 0 |
| C | 0 | 3142 | 0 |
| D | 0 | 3142 | 0 |
| Mode M0 | |||
|---|---|---|---|
| Quadrant | BADHDUFLAG | Total packets | Discarded packets |
| A | 0 | 754338 | 0 |
| B | 0 | 406987 | 0 |
| C | 0 | 336506 | 0 |
| D | 0 | 505503 | 0 |
| Quadrant | Total seconds | Saturated seconds | Saturation percentage |
|---|---|---|---|
| A | 154747 | 43684 | 28.229303% |
| B | 154748 | 7924 | 5.120583% |
| C | 154748 | 2710 | 1.751234% |
| D | 154747 | 19443 | 12.564379% |
Noise dominated data is calculated using 1-second bins in cleaned event files. If a bin has >2000 counts, and if more than 50% of those come from <1% of pixels, then it is considered to be noise-dominated and hence unusable.
| Quadrant | # 1 sec bins | Bins with >0 counts | Bins with >2000 counts | High rate bins dominated by noise | Noise dominated (total time) | Noise dominated (detector-on time) | Marked lightcurve |
|---|---|---|---|---|---|---|---|
| A | 173053 | 151605 | 0 | 0 | 0.00% | 0.00% |  |
| B | 173053 | 154696 | 0 | 0 | 0.00% | 0.00% | 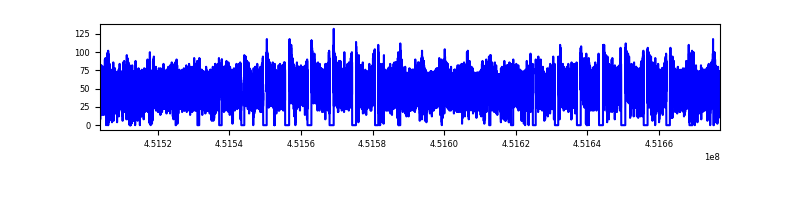 |
| C | 173053 | 154589 | 0 | 0 | 0.00% | 0.00% |  |
| D | 173053 | 154381 | 0 | 0 | 0.00% | 0.00% | 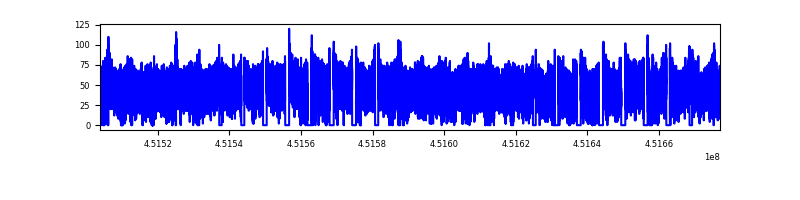 |
Top three noisy pixels from each quadrant. If the there are fewer than three noisy pixels in the level2.evt file, extra rows are filled as -1
| Pixel properties | Quadrant properties | ||||||
|---|---|---|---|---|---|---|---|
| Quadrant | DetID | PixID | Counts | Sigma | Mean | Median | Sigma |
| A | 7 | 110 | 5601 | 8.69 | 1781 | 1663 | 453.2 |
| A | 0 | 29 | 5345 | 8.13 | 1781 | 1663 | 453.2 |
| A | 14 | 95 | 5112 | 7.61 | 1781 | 1663 | 453.2 |
| B | 2 | 9 | 7207 | 13.35 | 2043 | 1944 | 394.3 |
| B | 2 | 8 | 5741 | 9.63 | 2043 | 1944 | 394.3 |
| B | 3 | 17 | 5664 | 9.43 | 2043 | 1944 | 394.3 |
| C | 3 | 202 | 6260 | 7.56 | 2159 | 1997 | 564.1 |
| C | 1 | 81 | 6143 | 7.35 | 2159 | 1997 | 564.1 |
| C | 1 | 80 | 6010 | 7.11 | 2159 | 1997 | 564.1 |
| D | 15 | 47 | 4884 | 6.01 | 1894 | 1719 | 526.5 |
| D | 10 | 189 | 4811 | 5.87 | 1894 | 1719 | 526.5 |
| D | 3 | 31 | 4769 | 5.79 | 1894 | 1719 | 526.5 |
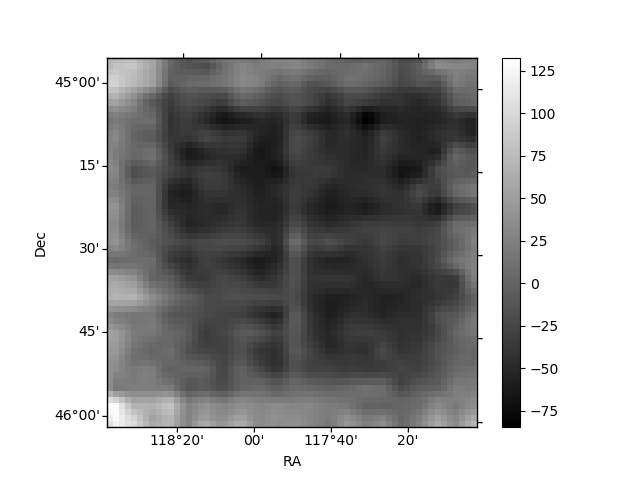
Histogram calculated using DETX and DETY for each event in the final _common_clean file
| Quadrant A |  |
 |
Quadrant B |
|---|---|---|---|
| Quadrant D | 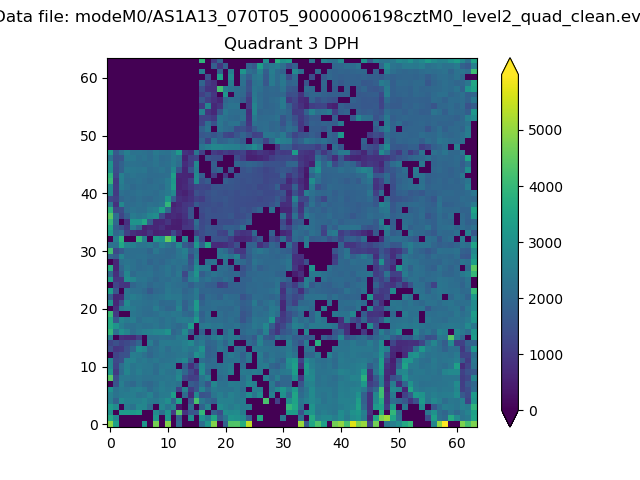 |
 |
Quadrant C |
| Plot type | Count rate plots | Images |
|---|---|---|
| Comparison with Poisson distribution Blue bars denote a histogram of data divided into 1 sec bins. Red curve is a Poisson curve with rate = median count rate of data. |
 |
 |
| Quadrant-wise count rates Data is divided into 100 sec bins |
 |
|
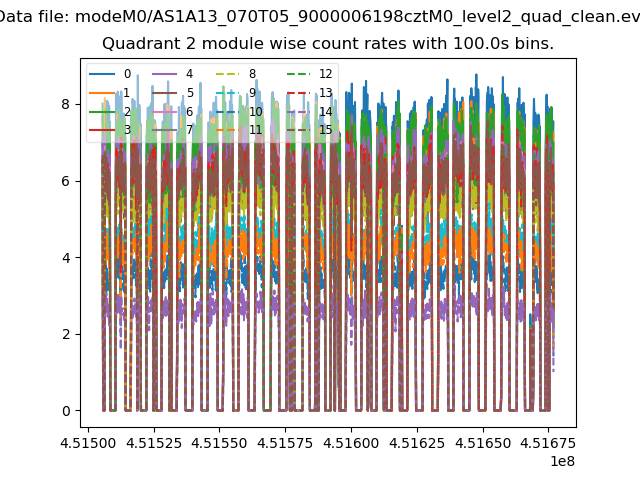
| Module-wise count rates for Quadrant A Data is divided into 100 sec bins |
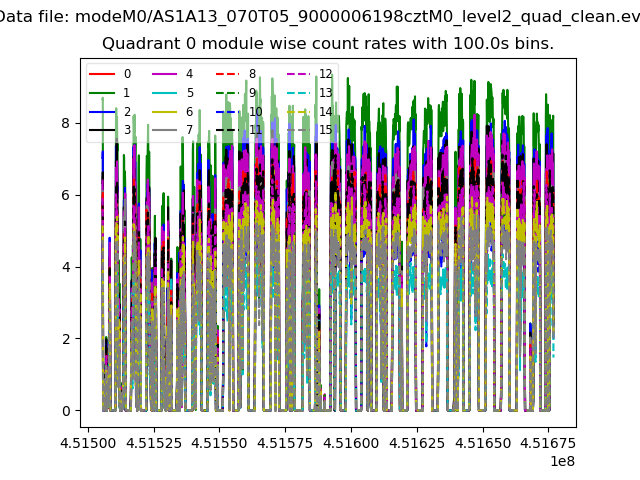 |
 |
| Module-wise count rates for Quadrant B Data is divided into 100 sec bins |
 |
 |
| Module-wise count rates for Quadrant C Data is divided into 100 sec bins |
 |
 |
| Module-wise count rates for Quadrant D Data is divided into 100 sec bins |
 |
 |
| Parameter | Plot |
|---|---|
| CZT HV Monitor | 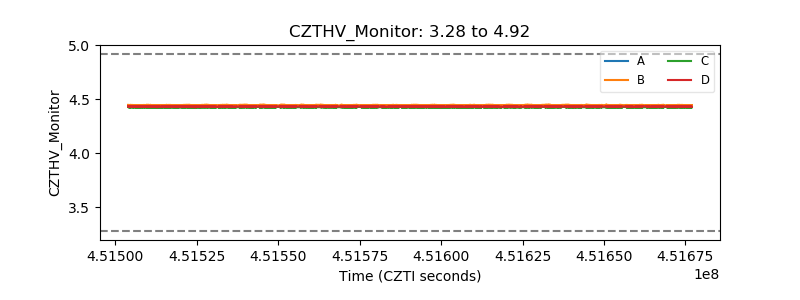 |
| D_VDD |  |
| Temperature 1 |  |
| Veto HV Monitor |  |
| Veto LLD |  |
| Alpha Counter |  |
| _CPM_Rate |  |
| CZT Counter | 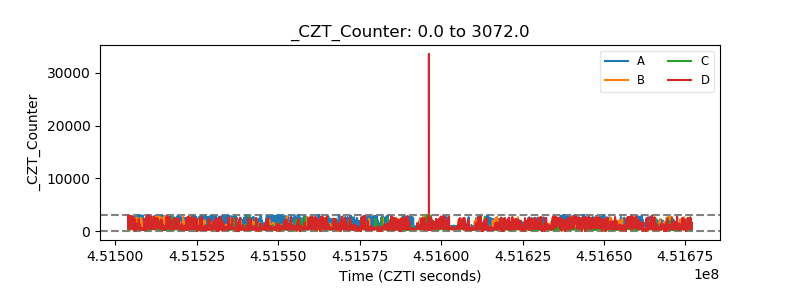 |
| +2.5 Volts monitor |  |
| +5 Volts monitor | 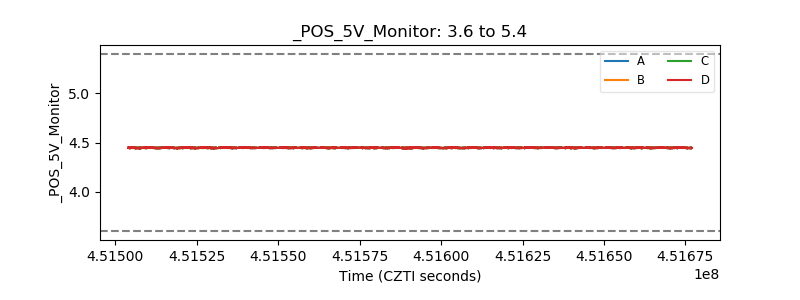 |
| _ROLL_ROT |  |
| _Roll_DEC |  |
| _Roll_RA |  |
| Veto Counter |  |