| Param | Original file | Final file |
|---|---|---|
| Filename | modeM0/AS1A13_072T02_9000006194cztM0_level2.fits | modeM0/AS1A13_072T02_9000006194cztM0_level2_quad_clean.evt |
| Size (bytes) | 1,063,238,400 | 1,105,413,120 |
| Size | 1014.0 MB | 1.0 GB |
| Events in quadrant A | 6,246,480 | 6,579,433 |
| Events in quadrant B | 6,016,222 | 6,612,999 |
| Events in quadrant C | 6,387,676 | 6,452,260 |
| Events in quadrant D | 5,437,798 | 5,728,289 |
| Mode M9 | |||
|---|---|---|---|
| Quadrant | BADHDUFLAG | Total packets | Discarded packets |
| A | 0 | 121 | 0 |
| B | 0 | 121 | 0 |
| C | 0 | 121 | 0 |
| D | 0 | 121 | 0 |
| Mode M0 | |||
|---|---|---|---|
| Quadrant | BADHDUFLAG | Total packets | Discarded packets |
| A | 0 | 382175 | 0 |
| B | 0 | 319602 | 0 |
| C | 0 | 250408 | 0 |
| D | 0 | 296378 | 0 |
| Mode SS | |||
|---|---|---|---|
| Quadrant | BADHDUFLAG | Total packets | Discarded packets |
| A | 0 | 2310 | 0 |
| B | 0 | 2310 | 0 |
| C | 0 | 2310 | 0 |
| D | 0 | 2310 | 0 |
| Quadrant | Total seconds | Saturated seconds | Saturation percentage |
|---|---|---|---|
| A | 118584 | 4359 | 3.675875% |
| B | 118584 | 6008 | 5.066451% |
| C | 118584 | 1607 | 1.355158% |
| D | 118584 | 4888 | 4.121973% |
Noise dominated data is calculated using 1-second bins in cleaned event files. If a bin has >2000 counts, and if more than 50% of those come from <1% of pixels, then it is considered to be noise-dominated and hence unusable.
| Quadrant | # 1 sec bins | Bins with >0 counts | Bins with >2000 counts | High rate bins dominated by noise | Noise dominated (total time) | Noise dominated (detector-on time) | Marked lightcurve |
|---|---|---|---|---|---|---|---|
| A | 130479 | 118579 | 0 | 0 | 0.00% | 0.00% | 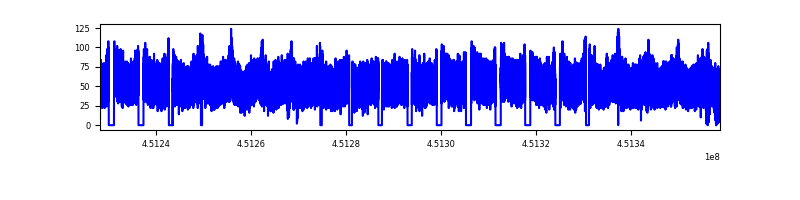 |
| B | 130479 | 118495 | 0 | 0 | 0.00% | 0.00% |  |
| C | 130479 | 118582 | 0 | 0 | 0.00% | 0.00% |  |
| D | 130479 | 118501 | 0 | 0 | 0.00% | 0.00% |  |
Top three noisy pixels from each quadrant. If the there are fewer than three noisy pixels in the level2.evt file, extra rows are filled as -1
| Pixel properties | Quadrant properties | ||||||
|---|---|---|---|---|---|---|---|
| Quadrant | DetID | PixID | Counts | Sigma | Mean | Median | Sigma |
| A | 15 | 236 | 5101 | 8.6 | 1627 | 1510 | 417.6 |
| A | 7 | 110 | 5100 | 8.6 | 1627 | 1510 | 417.6 |
| A | 0 | 29 | 4738 | 7.73 | 1627 | 1510 | 417.6 |
| B | 2 | 9 | 5626 | 12.9 | 1584 | 1498 | 320.0 |
| B | 3 | 17 | 4492 | 9.36 | 1584 | 1498 | 320.0 |
| B | 2 | 8 | 4456 | 9.24 | 1584 | 1498 | 320.0 |
| C | 3 | 202 | 4858 | 7.46 | 1688 | 1563 | 441.7 |
| C | 1 | 81 | 4773 | 7.27 | 1688 | 1563 | 441.7 |
| C | 3 | 203 | 4663 | 7.02 | 1688 | 1563 | 441.7 |
| D | 15 | 47 | 3943 | 5.87 | 1558 | 1412 | 430.9 |
| D | 10 | 189 | 3858 | 5.68 | 1558 | 1412 | 430.9 |
| D | 15 | 63 | 3849 | 5.66 | 1558 | 1412 | 430.9 |
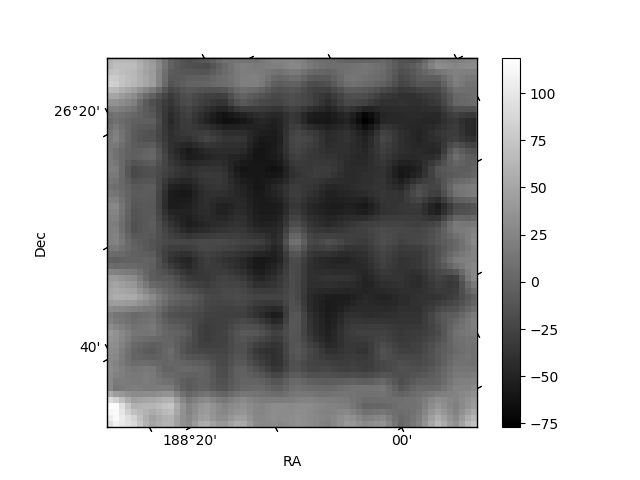
Histogram calculated using DETX and DETY for each event in the final _common_clean file
| Quadrant A |  |
 |
Quadrant B |
|---|---|---|---|
| Quadrant D |  |
 |
Quadrant C |
| Plot type | Count rate plots | Images |
|---|---|---|
| Comparison with Poisson distribution Blue bars denote a histogram of data divided into 1 sec bins. Red curve is a Poisson curve with rate = median count rate of data. |
 |
 |
| Quadrant-wise count rates Data is divided into 100 sec bins |
 |
|
| Module-wise count rates for Quadrant A Data is divided into 100 sec bins |
 |
 |
| Module-wise count rates for Quadrant B Data is divided into 100 sec bins |
 |
 |
| Module-wise count rates for Quadrant C Data is divided into 100 sec bins |
 |
 |
| Module-wise count rates for Quadrant D Data is divided into 100 sec bins |
 |
 |
| Parameter | Plot |
|---|---|
| CZT HV Monitor | 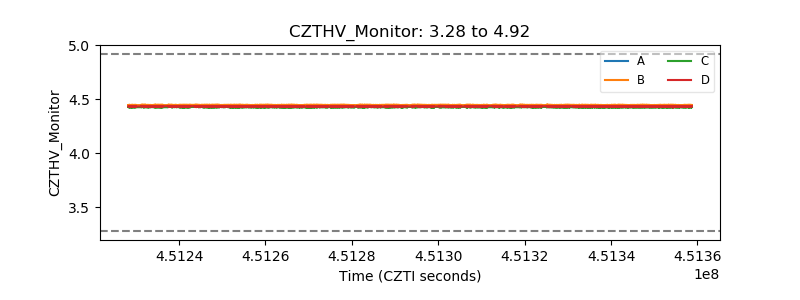 |
| D_VDD |  |
| Temperature 1 | 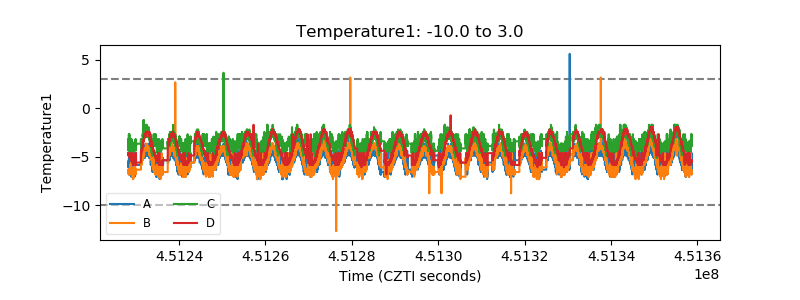 |
| Veto HV Monitor |  |
| Veto LLD |  |
| Alpha Counter |  |
| _CPM_Rate | 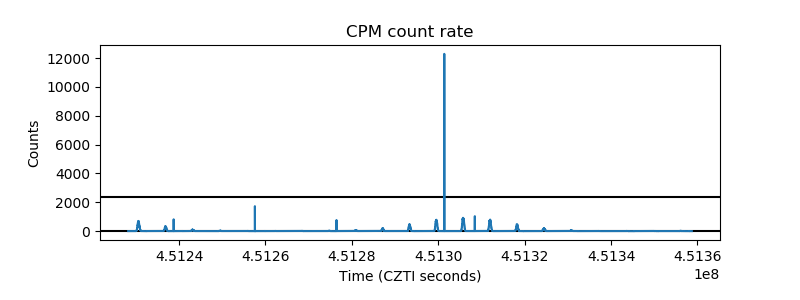 |
| CZT Counter |  |
| +2.5 Volts monitor |  |
| +5 Volts monitor |  |
| _ROLL_ROT |  |
| _Roll_DEC |  |
| _Roll_RA |  |
| Veto Counter |  |