| Param | Original file | Final file |
|---|---|---|
| Filename | modeM0/AS1A13_072T01_9000006192cztM0_level2.fits | modeM0/AS1A13_072T01_9000006192cztM0_level2_quad_clean.evt |
| Size (bytes) | 766,131,840 | 918,201,600 |
| Size | 730.6 MB | 875.7 MB |
| Events in quadrant A | 4,483,100 | 5,647,280 |
| Events in quadrant B | 4,344,934 | 5,714,782 |
| Events in quadrant C | 4,601,210 | 5,668,544 |
| Events in quadrant D | 3,814,406 | 4,825,472 |
| Mode M0 | |||
|---|---|---|---|
| Quadrant | BADHDUFLAG | Total packets | Discarded packets |
| A | 0 | 279009 | 0 |
| B | 0 | 244309 | 0 |
| C | 0 | 180474 | 0 |
| D | 0 | 254049 | 0 |
| Mode M9 | |||
|---|---|---|---|
| Quadrant | BADHDUFLAG | Total packets | Discarded packets |
| A | 0 | 108 | 0 |
| B | 0 | 108 | 0 |
| C | 0 | 108 | 0 |
| D | 0 | 108 | 0 |
| Mode SS | |||
|---|---|---|---|
| Quadrant | BADHDUFLAG | Total packets | Discarded packets |
| A | 0 | 1762 | 0 |
| B | 0 | 1762 | 0 |
| C | 0 | 1762 | 0 |
| D | 0 | 1762 | 0 |
| Quadrant | Total seconds | Saturated seconds | Saturation percentage |
|---|---|---|---|
| A | 86851 | 2370 | 2.728811% |
| B | 86853 | 2782 | 3.203113% |
| C | 86853 | 817 | 0.940670% |
| D | 86852 | 6826 | 7.859347% |
Noise dominated data is calculated using 1-second bins in cleaned event files. If a bin has >2000 counts, and if more than 50% of those come from <1% of pixels, then it is considered to be noise-dominated and hence unusable.
| Quadrant | # 1 sec bins | Bins with >0 counts | Bins with >2000 counts | High rate bins dominated by noise | Noise dominated (total time) | Noise dominated (detector-on time) | Marked lightcurve |
|---|---|---|---|---|---|---|---|
| A | 108627 | 86850 | 0 | 0 | 0.00% | 0.00% | 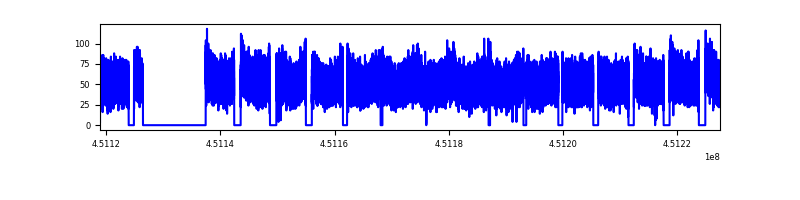 |
| B | 108627 | 86844 | 0 | 0 | 0.00% | 0.00% |  |
| C | 108627 | 86851 | 0 | 0 | 0.00% | 0.00% |  |
| D | 108628 | 86722 | 0 | 0 | 0.00% | 0.00% |  |
Top three noisy pixels from each quadrant. If the there are fewer than three noisy pixels in the level2.evt file, extra rows are filled as -1
| Pixel properties | Quadrant properties | ||||||
|---|---|---|---|---|---|---|---|
| Quadrant | DetID | PixID | Counts | Sigma | Mean | Median | Sigma |
| A | 7 | 110 | 3509 | 7.97 | 1171 | 1092 | 303.3 |
| A | 15 | 236 | 3484 | 7.89 | 1171 | 1092 | 303.3 |
| A | 0 | 29 | 3423 | 7.69 | 1171 | 1092 | 303.3 |
| B | 2 | 9 | 4069 | 13.44 | 1146 | 1089 | 221.7 |
| B | 2 | 8 | 3274 | 9.85 | 1146 | 1089 | 221.7 |
| B | 3 | 17 | 3086 | 9.01 | 1146 | 1089 | 221.7 |
| C | 3 | 202 | 3653 | 7.88 | 1218 | 1133 | 319.9 |
| C | 1 | 81 | 3480 | 7.34 | 1218 | 1133 | 319.9 |
| C | 3 | 203 | 3451 | 7.25 | 1218 | 1133 | 319.9 |
| D | 12 | 6 | 2855 | 6.21 | 1092 | 996 | 299.5 |
| D | 15 | 47 | 2809 | 6.05 | 1092 | 996 | 299.5 |
| D | 10 | 189 | 2786 | 5.98 | 1092 | 996 | 299.5 |
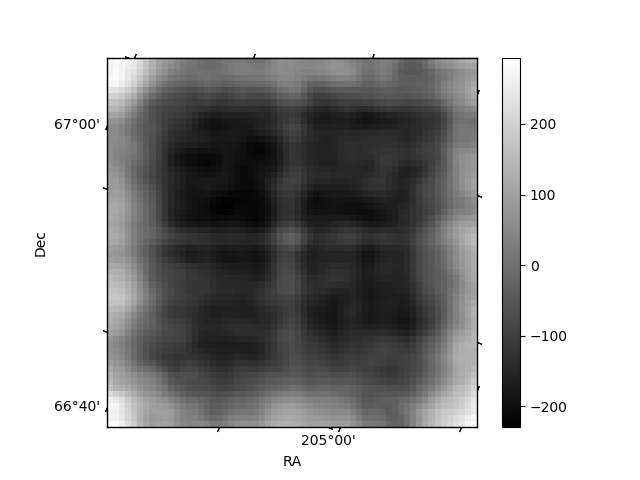
Histogram calculated using DETX and DETY for each event in the final _common_clean file
| Quadrant A |  |
 |
Quadrant B |
|---|---|---|---|
| Quadrant D |  |
 |
Quadrant C |
| Plot type | Count rate plots | Images |
|---|---|---|
| Comparison with Poisson distribution Blue bars denote a histogram of data divided into 1 sec bins. Red curve is a Poisson curve with rate = median count rate of data. |
 |
 |
| Quadrant-wise count rates Data is divided into 100 sec bins |
 |
|
| Module-wise count rates for Quadrant A Data is divided into 100 sec bins |
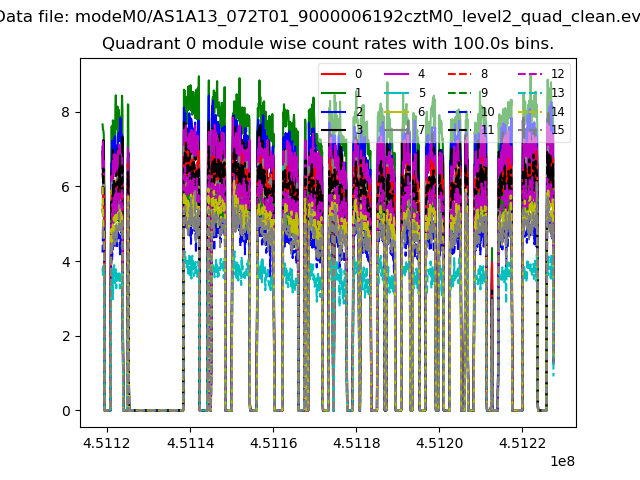 |
 |
| Module-wise count rates for Quadrant B Data is divided into 100 sec bins |
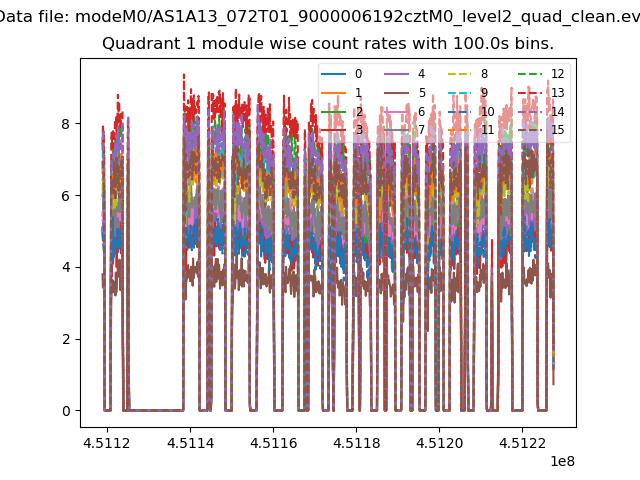 |
 |
| Module-wise count rates for Quadrant C Data is divided into 100 sec bins |
 |
 |
| Module-wise count rates for Quadrant D Data is divided into 100 sec bins |
 |
 |
| Parameter | Plot |
|---|---|
| CZT HV Monitor | 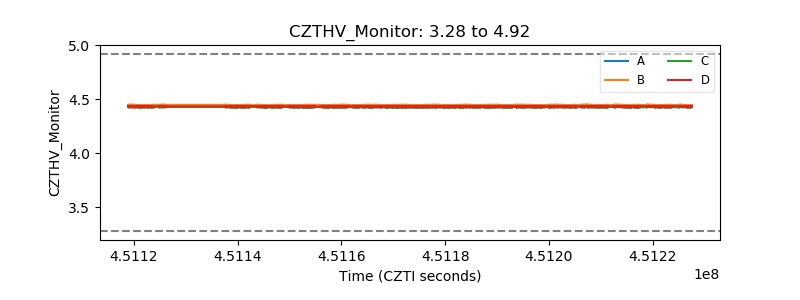 |
| D_VDD | 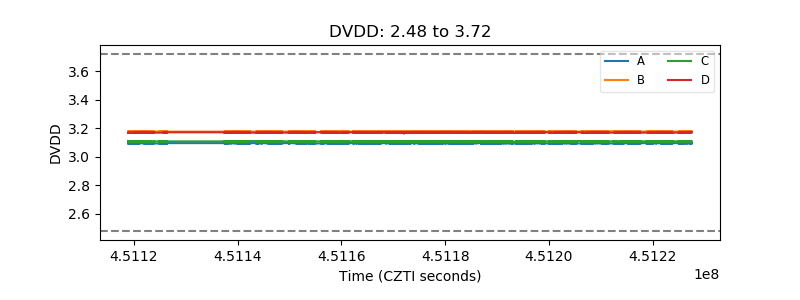 |
| Temperature 1 |  |
| Veto HV Monitor |  |
| Veto LLD |  |
| Alpha Counter |  |
| _CPM_Rate |  |
| CZT Counter |  |
| +2.5 Volts monitor | 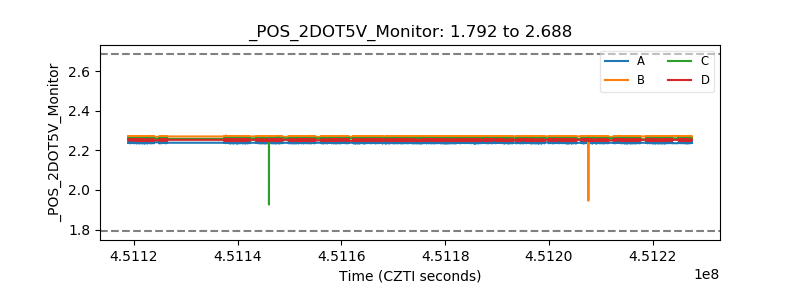 |
| +5 Volts monitor |  |
| _ROLL_ROT |  |
| _Roll_DEC | 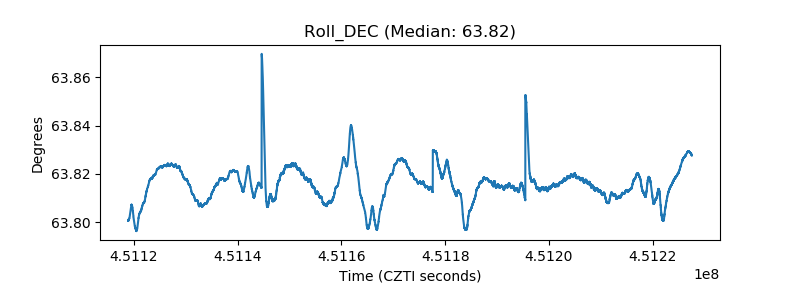 |
| _Roll_RA |  |
| Veto Counter | 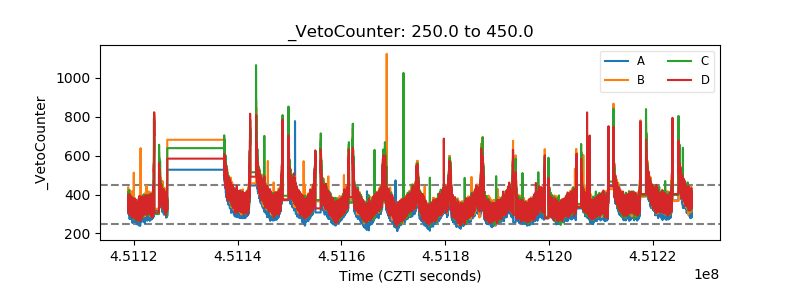 |