| Param | Original file | Final file |
|---|---|---|
| Filename | modeM0/AS1A13_094T02_9000006190cztM0_level2.fits | modeM0/AS1A13_094T02_9000006190cztM0_level2_quad_clean.evt |
| Size (bytes) | 537,989,760 | 777,576,960 |
| Size | 513.1 MB | 741.6 MB |
| Events in quadrant A | 3,108,502 | 4,918,957 |
| Events in quadrant B | 3,041,270 | 5,054,876 |
| Events in quadrant C | 3,205,822 | 5,039,902 |
| Events in quadrant D | 2,638,964 | 4,243,530 |
| Mode SS | |||
|---|---|---|---|
| Quadrant | BADHDUFLAG | Total packets | Discarded packets |
| A | 0 | 1272 | 0 |
| B | 0 | 1272 | 0 |
| C | 0 | 1272 | 0 |
| D | 0 | 1272 | 0 |
| Mode M0 | |||
|---|---|---|---|
| Quadrant | BADHDUFLAG | Total packets | Discarded packets |
| A | 0 | 212192 | 0 |
| B | 0 | 158333 | 0 |
| C | 0 | 137497 | 0 |
| D | 0 | 192927 | 0 |
| Mode M9 | |||
|---|---|---|---|
| Quadrant | BADHDUFLAG | Total packets | Discarded packets |
| A | 0 | 68 | 0 |
| B | 0 | 68 | 0 |
| C | 0 | 68 | 0 |
| D | 0 | 68 | 0 |
| Quadrant | Total seconds | Saturated seconds | Saturation percentage |
|---|---|---|---|
| A | 62607 | 1950 | 3.114668% |
| B | 62608 | 1627 | 2.598709% |
| C | 62607 | 912 | 1.456706% |
| D | 62607 | 5766 | 9.209833% |
Noise dominated data is calculated using 1-second bins in cleaned event files. If a bin has >2000 counts, and if more than 50% of those come from <1% of pixels, then it is considered to be noise-dominated and hence unusable.
| Quadrant | # 1 sec bins | Bins with >0 counts | Bins with >2000 counts | High rate bins dominated by noise | Noise dominated (total time) | Noise dominated (detector-on time) | Marked lightcurve |
|---|---|---|---|---|---|---|---|
| A | 74732 | 62596 | 0 | 0 | 0.00% | 0.00% | 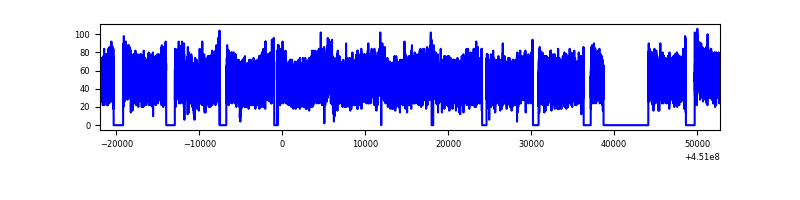 |
| B | 74732 | 62593 | 0 | 0 | 0.00% | 0.00% | 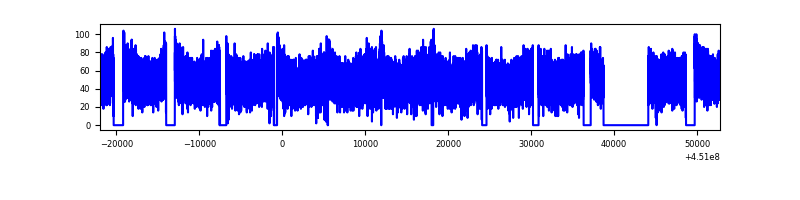 |
| C | 74732 | 62587 | 0 | 0 | 0.00% | 0.00% |  |
| D | 74732 | 62544 | 0 | 0 | 0.00% | 0.00% | 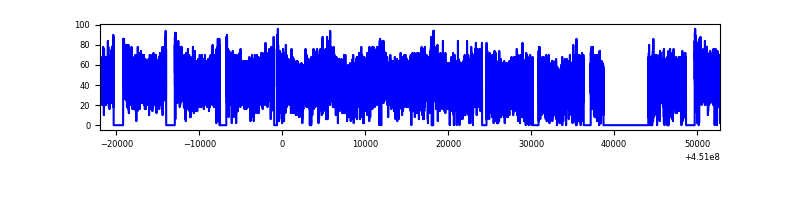 |
Top three noisy pixels from each quadrant. If the there are fewer than three noisy pixels in the level2.evt file, extra rows are filled as -1
| Pixel properties | Quadrant properties | ||||||
|---|---|---|---|---|---|---|---|
| Quadrant | DetID | PixID | Counts | Sigma | Mean | Median | Sigma |
| A | 15 | 236 | 2527 | 8.47 | 812 | 760 | 208.5 |
| A | 7 | 110 | 2460 | 8.15 | 812 | 760 | 208.5 |
| A | 0 | 29 | 2412 | 7.92 | 812 | 760 | 208.5 |
| B | 2 | 9 | 2940 | 13.98 | 805 | 767 | 155.5 |
| B | 2 | 8 | 2361 | 10.25 | 805 | 767 | 155.5 |
| B | 3 | 17 | 2258 | 9.59 | 805 | 767 | 155.5 |
| C | 3 | 202 | 2483 | 7.67 | 848 | 790 | 220.7 |
| C | 1 | 80 | 2394 | 7.27 | 848 | 790 | 220.7 |
| C | 3 | 203 | 2374 | 7.18 | 848 | 790 | 220.7 |
| D | 15 | 47 | 1968 | 6.0 | 758 | 686 | 213.5 |
| D | 10 | 189 | 1963 | 5.98 | 758 | 686 | 213.5 |
| D | 4 | 16 | 1952 | 5.93 | 758 | 686 | 213.5 |
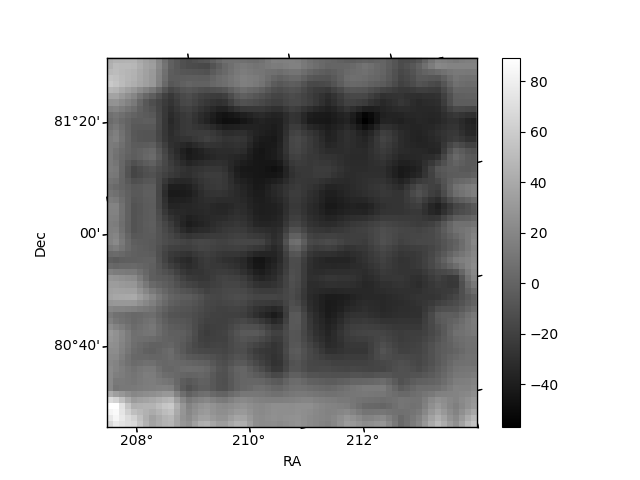
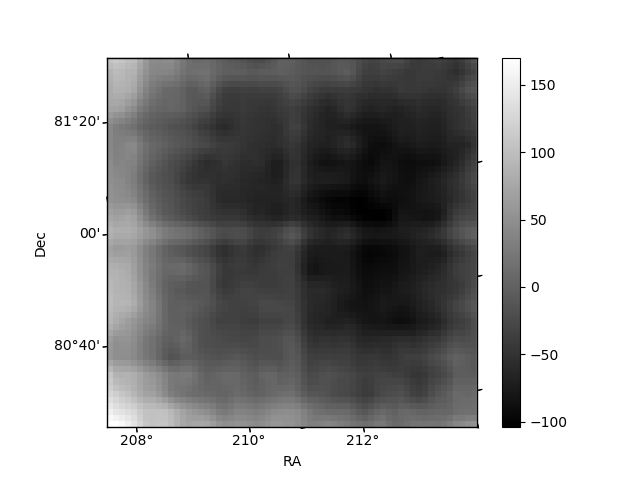
Histogram calculated using DETX and DETY for each event in the final _common_clean file
| Quadrant A | 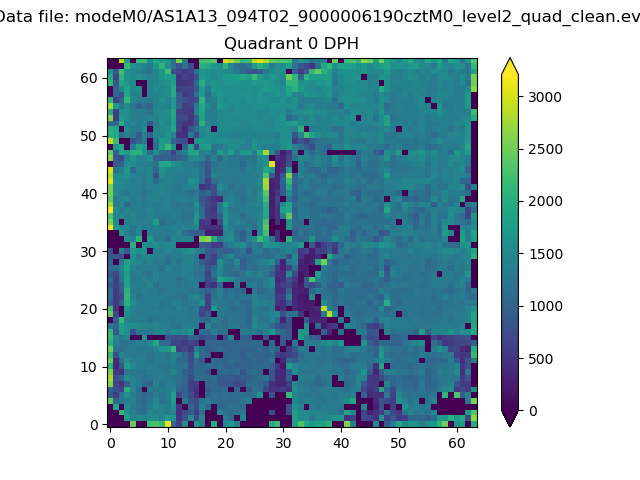 |
 |
Quadrant B |
|---|---|---|---|
| Quadrant D |  |
 |
Quadrant C |
| Plot type | Count rate plots | Images |
|---|---|---|
| Comparison with Poisson distribution Blue bars denote a histogram of data divided into 1 sec bins. Red curve is a Poisson curve with rate = median count rate of data. |
 |
 |
| Quadrant-wise count rates Data is divided into 100 sec bins |
 |
|
| Module-wise count rates for Quadrant A Data is divided into 100 sec bins |
 |
 |
| Module-wise count rates for Quadrant B Data is divided into 100 sec bins |
 |
 |
| Module-wise count rates for Quadrant C Data is divided into 100 sec bins |
 |
 |
| Module-wise count rates for Quadrant D Data is divided into 100 sec bins |
 |
 |
| Parameter | Plot |
|---|---|
| CZT HV Monitor |  |
| D_VDD |  |
| Temperature 1 |  |
| Veto HV Monitor |  |
| Veto LLD |  |
| Alpha Counter |  |
| _CPM_Rate | 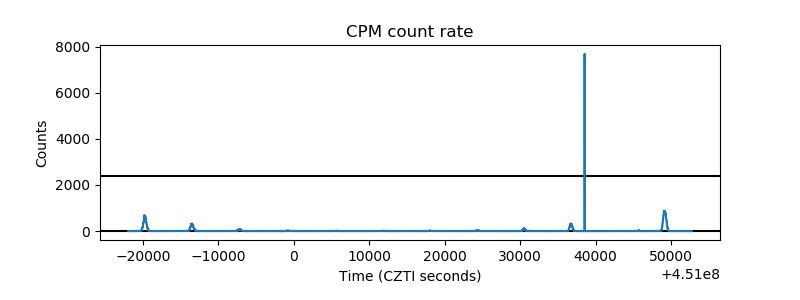 |
| CZT Counter |  |
| +2.5 Volts monitor |  |
| +5 Volts monitor | 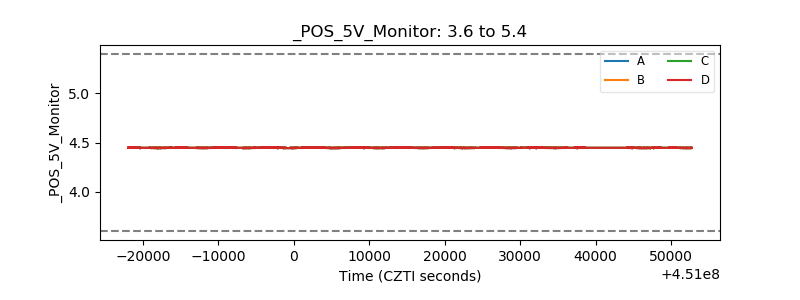 |
| _ROLL_ROT |  |
| _Roll_DEC |  |
| _Roll_RA |  |
| Veto Counter |  |