| Param | Original file | Final file |
|---|---|---|
| Filename | modeM0/AS1A13_065T07_9000006188cztM0_level2.fits | modeM0/AS1A13_065T07_9000006188cztM0_level2_quad_clean.evt |
| Size (bytes) | 586,261,440 | 628,280,640 |
| Size | 559.1 MB | 599.2 MB |
| Events in quadrant A | 3,424,736 | 3,699,067 |
| Events in quadrant B | 3,356,908 | 3,828,587 |
| Events in quadrant C | 3,480,804 | 3,723,256 |
| Events in quadrant D | 2,947,968 | 3,235,087 |
| Mode M0 | |||
|---|---|---|---|
| Quadrant | BADHDUFLAG | Total packets | Discarded packets |
| A | 0 | 218272 | 0 |
| B | 0 | 154288 | 0 |
| C | 0 | 143572 | 0 |
| D | 0 | 172795 | 0 |
| Mode SS | |||
|---|---|---|---|
| Quadrant | BADHDUFLAG | Total packets | Discarded packets |
| A | 0 | 1342 | 0 |
| B | 0 | 1342 | 0 |
| C | 0 | 1342 | 0 |
| D | 0 | 1342 | 0 |
| Mode M9 | |||
|---|---|---|---|
| Quadrant | BADHDUFLAG | Total packets | Discarded packets |
| A | 0 | 71 | 0 |
| B | 0 | 71 | 0 |
| C | 0 | 71 | 0 |
| D | 0 | 71 | 0 |
| Quadrant | Total seconds | Saturated seconds | Saturation percentage |
|---|---|---|---|
| A | 66215 | 2052 | 3.098996% |
| B | 66221 | 1247 | 1.883088% |
| C | 66223 | 990 | 1.494949% |
| D | 66224 | 3301 | 4.984598% |
Noise dominated data is calculated using 1-second bins in cleaned event files. If a bin has >2000 counts, and if more than 50% of those come from <1% of pixels, then it is considered to be noise-dominated and hence unusable.
| Quadrant | # 1 sec bins | Bins with >0 counts | Bins with >2000 counts | High rate bins dominated by noise | Noise dominated (total time) | Noise dominated (detector-on time) | Marked lightcurve |
|---|---|---|---|---|---|---|---|
| A | 79411 | 66217 | 0 | 0 | 0.00% | 0.00% |  |
| B | 79411 | 66217 | 0 | 0 | 0.00% | 0.00% |  |
| C | 79411 | 66198 | 0 | 0 | 0.00% | 0.00% |  |
| D | 79411 | 66108 | 0 | 0 | 0.00% | 0.00% |  |
Top three noisy pixels from each quadrant. If the there are fewer than three noisy pixels in the level2.evt file, extra rows are filled as -1
| Pixel properties | Quadrant properties | ||||||
|---|---|---|---|---|---|---|---|
| Quadrant | DetID | PixID | Counts | Sigma | Mean | Median | Sigma |
| A | 7 | 110 | 2667 | 7.96 | 892 | 831 | 230.6 |
| A | 0 | 29 | 2651 | 7.89 | 892 | 831 | 230.6 |
| A | 15 | 236 | 2649 | 7.88 | 892 | 831 | 230.6 |
| B | 2 | 9 | 3159 | 13.14 | 888 | 845 | 176.2 |
| B | 2 | 8 | 2547 | 9.66 | 888 | 845 | 176.2 |
| B | 3 | 17 | 2412 | 8.9 | 888 | 845 | 176.2 |
| C | 3 | 202 | 2640 | 7.42 | 920 | 852 | 241.0 |
| C | 3 | 203 | 2608 | 7.29 | 920 | 852 | 241.0 |
| C | 1 | 81 | 2572 | 7.14 | 920 | 852 | 241.0 |
| D | 15 | 47 | 2233 | 6.21 | 847 | 769 | 235.7 |
| D | 7 | 3 | 2115 | 5.71 | 847 | 769 | 235.7 |
| D | 10 | 189 | 2110 | 5.69 | 847 | 769 | 235.7 |
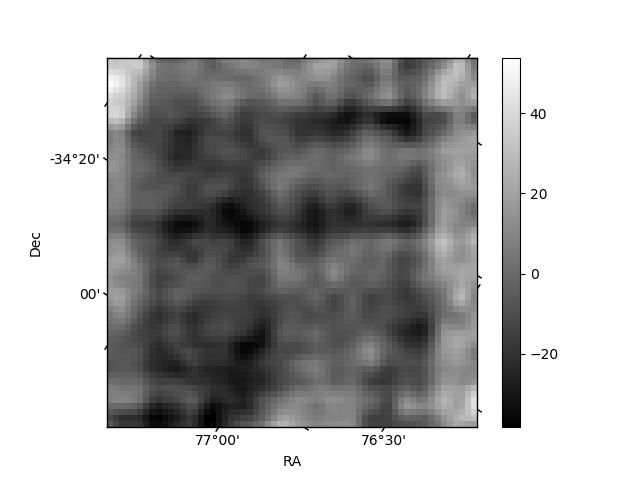
Histogram calculated using DETX and DETY for each event in the final _common_clean file
| Quadrant A |  |
 |
Quadrant B |
|---|---|---|---|
| Quadrant D |  |
 |
Quadrant C |
| Plot type | Count rate plots | Images |
|---|---|---|
| Comparison with Poisson distribution Blue bars denote a histogram of data divided into 1 sec bins. Red curve is a Poisson curve with rate = median count rate of data. |
 |
 |
| Quadrant-wise count rates Data is divided into 100 sec bins |
 |
|
| Module-wise count rates for Quadrant A Data is divided into 100 sec bins |
 |
 |
| Module-wise count rates for Quadrant B Data is divided into 100 sec bins |
 |
 |
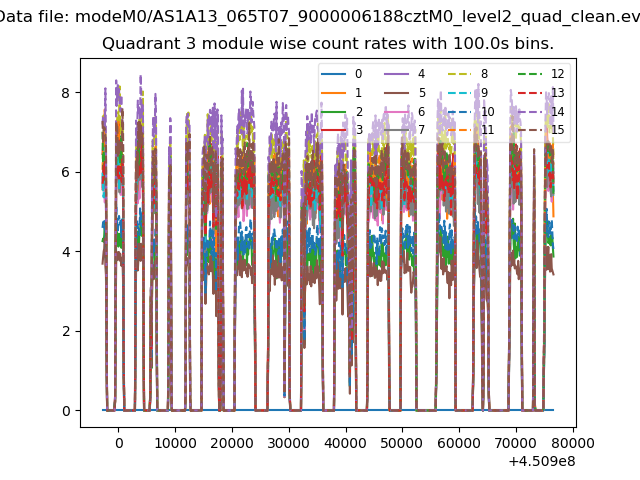
| Module-wise count rates for Quadrant C Data is divided into 100 sec bins |
 |
 |
| Module-wise count rates for Quadrant D Data is divided into 100 sec bins |
 |
 |
| Parameter | Plot |
|---|---|
| CZT HV Monitor |  |
| D_VDD |  |
| Temperature 1 |  |
| Veto HV Monitor |  |
| Veto LLD |  |
| Alpha Counter |  |
| _CPM_Rate | 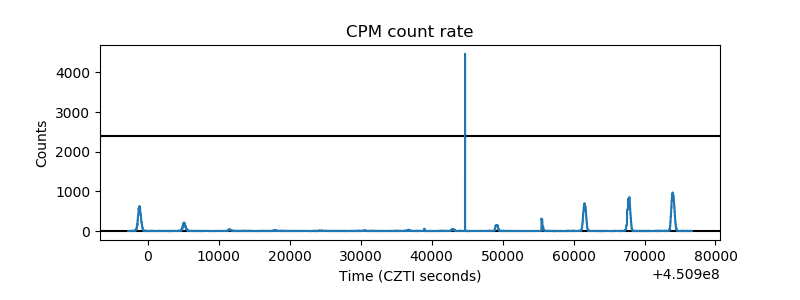 |
| CZT Counter |  |
| +2.5 Volts monitor | 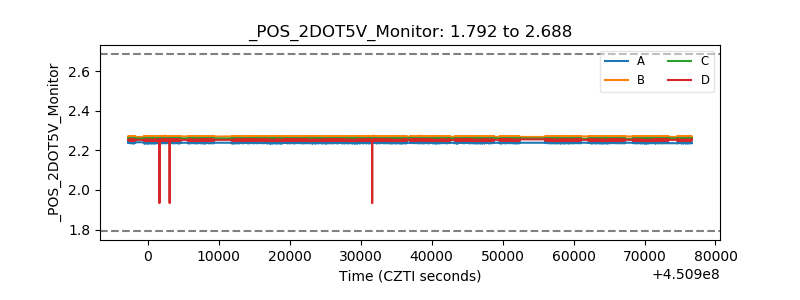 |
| +5 Volts monitor |  |
| _ROLL_ROT |  |
| _Roll_DEC |  |
| _Roll_RA |  |
| Veto Counter |  |