| Param | Original file | Final file |
|---|---|---|
| Filename | modeM0/AS1A13_065T03_9000006186cztM0_level2.fits | modeM0/AS1A13_065T03_9000006186cztM0_level2_quad_clean.evt |
| Size (bytes) | 230,169,600 | 201,211,200 |
| Size | 219.5 MB | 191.9 MB |
| Events in quadrant A | 1,361,854 | 1,147,815 |
| Events in quadrant B | 1,330,908 | 1,162,565 |
| Events in quadrant C | 1,385,548 | 1,089,729 |
| Events in quadrant D | 1,193,806 | 994,579 |
| Mode SS | |||
|---|---|---|---|
| Quadrant | BADHDUFLAG | Total packets | Discarded packets |
| A | 0 | 498 | 0 |
| B | 0 | 498 | 0 |
| C | 0 | 498 | 0 |
| D | 0 | 498 | 0 |
| Mode M0 | |||
|---|---|---|---|
| Quadrant | BADHDUFLAG | Total packets | Discarded packets |
| A | 0 | 88122 | 0 |
| B | 0 | 64855 | 0 |
| C | 0 | 54373 | 0 |
| D | 0 | 58986 | 0 |
| Mode M9 | |||
|---|---|---|---|
| Quadrant | BADHDUFLAG | Total packets | Discarded packets |
| A | 0 | 37 | 0 |
| B | 0 | 37 | 0 |
| C | 0 | 37 | 0 |
| D | 0 | 37 | 0 |
| Quadrant | Total seconds | Saturated seconds | Saturation percentage |
|---|---|---|---|
| A | 24693 | 1022 | 4.138825% |
| B | 24694 | 778 | 3.150563% |
| C | 24691 | 450 | 1.822526% |
| D | 24695 | 827 | 3.348856% |
Noise dominated data is calculated using 1-second bins in cleaned event files. If a bin has >2000 counts, and if more than 50% of those come from <1% of pixels, then it is considered to be noise-dominated and hence unusable.
| Quadrant | # 1 sec bins | Bins with >0 counts | Bins with >2000 counts | High rate bins dominated by noise | Noise dominated (total time) | Noise dominated (detector-on time) | Marked lightcurve |
|---|---|---|---|---|---|---|---|
| A | 51547 | 24691 | 0 | 0 | 0.00% | 0.00% |  |
| B | 51547 | 24689 | 0 | 0 | 0.00% | 0.00% |  |
| C | 51548 | 24691 | 0 | 0 | 0.00% | 0.00% | 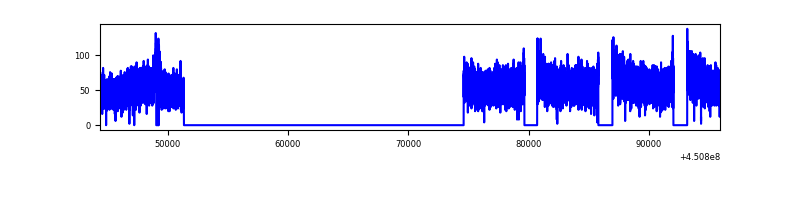 |
| D | 51548 | 24688 | 0 | 0 | 0.00% | 0.00% |  |
Top three noisy pixels from each quadrant. If the there are fewer than three noisy pixels in the level2.evt file, extra rows are filled as -1
| Pixel properties | Quadrant properties | ||||||
|---|---|---|---|---|---|---|---|
| Quadrant | DetID | PixID | Counts | Sigma | Mean | Median | Sigma |
| A | 7 | 110 | 1141 | 8.99 | 355 | 333 | 89.9 |
| A | 0 | 29 | 1083 | 8.34 | 355 | 333 | 89.9 |
| A | 15 | 236 | 1060 | 8.09 | 355 | 333 | 89.9 |
| B | 2 | 9 | 1249 | 13.11 | 351 | 335 | 69.7 |
| B | 2 | 8 | 969 | 9.09 | 351 | 335 | 69.7 |
| B | 3 | 17 | 943 | 8.72 | 351 | 335 | 69.7 |
| C | 3 | 202 | 1054 | 7.44 | 366 | 340 | 95.9 |
| C | 1 | 81 | 1048 | 7.37 | 366 | 340 | 95.9 |
| C | 1 | 80 | 1028 | 7.17 | 366 | 340 | 95.9 |
| D | 6 | 38 | 872 | 5.87 | 342 | 310 | 95.7 |
| D | 7 | 3 | 860 | 5.74 | 342 | 310 | 95.7 |
| D | 10 | 113 | 856 | 5.7 | 342 | 310 | 95.7 |
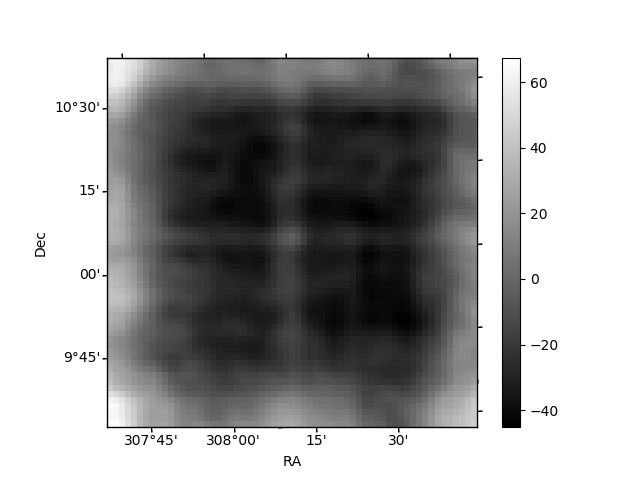
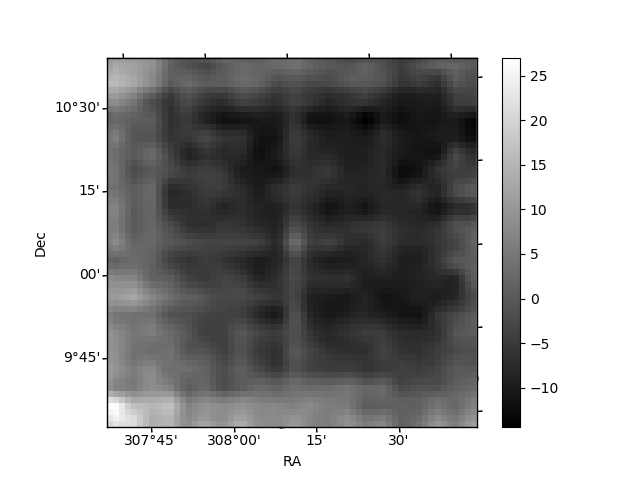
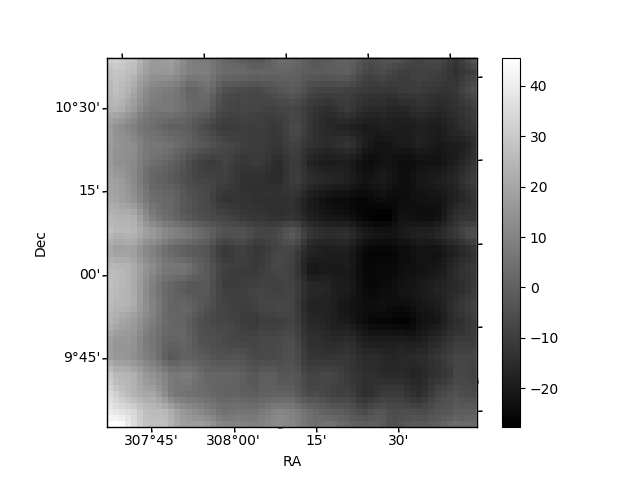
Histogram calculated using DETX and DETY for each event in the final _common_clean file
| Quadrant A |  |
 |
Quadrant B |
|---|---|---|---|
| Quadrant D |  |
 |
Quadrant C |
| Plot type | Count rate plots | Images |
|---|---|---|
| Comparison with Poisson distribution Blue bars denote a histogram of data divided into 1 sec bins. Red curve is a Poisson curve with rate = median count rate of data. |
 |
 |
| Quadrant-wise count rates Data is divided into 100 sec bins |
 |
|
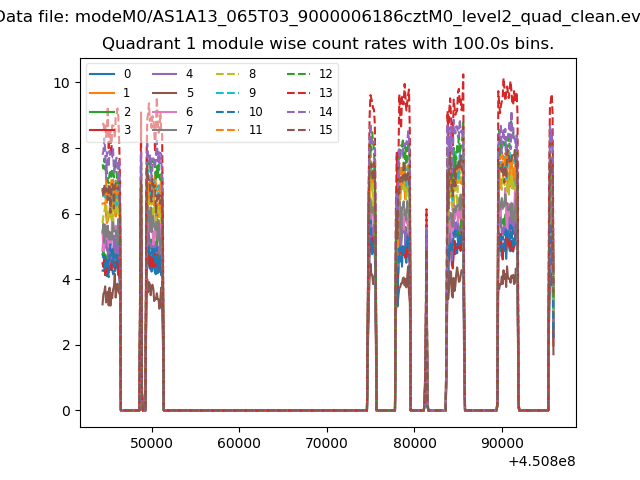
| Module-wise count rates for Quadrant A Data is divided into 100 sec bins |
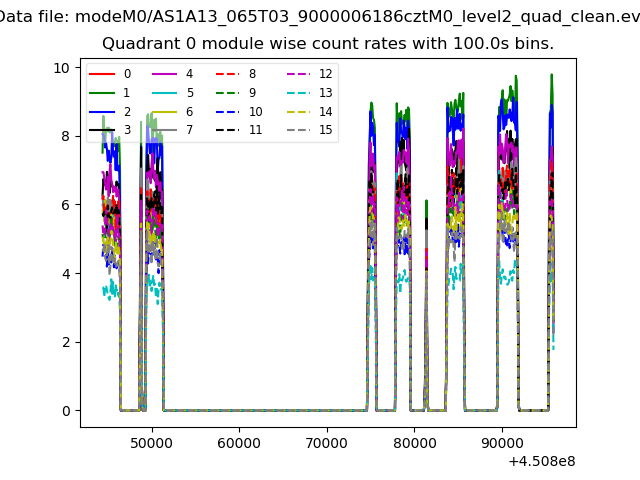 |
 |
| Module-wise count rates for Quadrant B Data is divided into 100 sec bins |
 |
 |
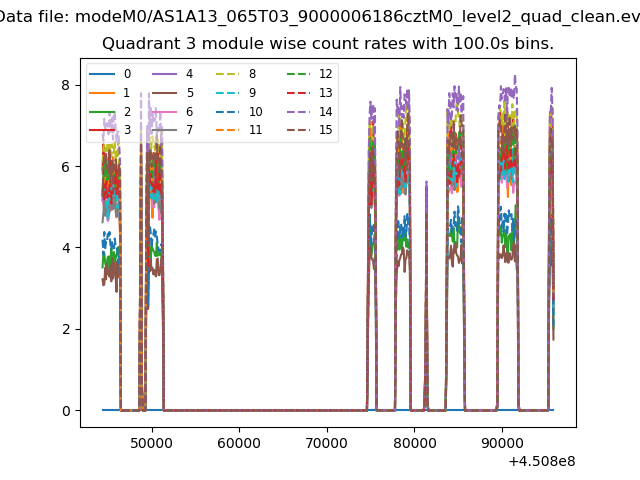
| Module-wise count rates for Quadrant C Data is divided into 100 sec bins |
 |
 |
| Module-wise count rates for Quadrant D Data is divided into 100 sec bins |
 |
 |
| Parameter | Plot |
|---|---|
| CZT HV Monitor | 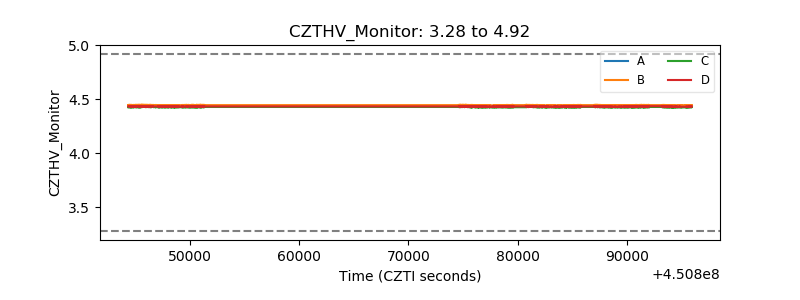 |
| D_VDD |  |
| Temperature 1 |  |
| Veto HV Monitor |  |
| Veto LLD |  |
| Alpha Counter |  |
| _CPM_Rate |  |
| CZT Counter |  |
| +2.5 Volts monitor |  |
| +5 Volts monitor |  |
| _ROLL_ROT |  |
| _Roll_DEC |  |
| _Roll_RA |  |
| Veto Counter | 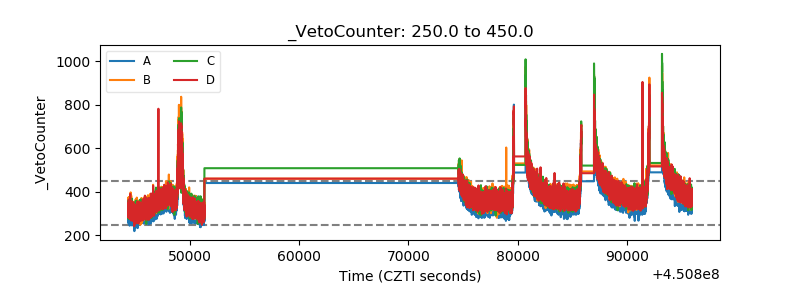 |