| Param | Original file | Final file |
|---|---|---|
| Filename | modeM0/AS1A13_093T40_9000006182cztM0_level2.fits | modeM0/AS1A13_093T40_9000006182cztM0_level2_quad_clean.evt |
| Size (bytes) | 1,282,233,600 | 1,592,565,120 |
| Size | 1.2 GB | 1.5 GB |
| Events in quadrant A | 7,562,462 | 10,009,426 |
| Events in quadrant B | 7,428,482 | 10,248,535 |
| Events in quadrant C | 7,623,664 | 9,736,459 |
| Events in quadrant D | 6,206,190 | 8,239,728 |
| Mode SS | |||
|---|---|---|---|
| Quadrant | BADHDUFLAG | Total packets | Discarded packets |
| A | 0 | 2960 | 0 |
| B | 0 | 2960 | 0 |
| C | 0 | 2960 | 0 |
| D | 0 | 2960 | 0 |
| Mode M0 | |||
|---|---|---|---|
| Quadrant | BADHDUFLAG | Total packets | Discarded packets |
| A | 0 | 493390 | 0 |
| B | 0 | 347004 | 0 |
| C | 0 | 311529 | 0 |
| D | 0 | 465264 | 0 |
| Mode M9 | |||
|---|---|---|---|
| Quadrant | BADHDUFLAG | Total packets | Discarded packets |
| A | 0 | 182 | 0 |
| B | 0 | 182 | 0 |
| C | 0 | 182 | 0 |
| D | 0 | 182 | 0 |
| Quadrant | Total seconds | Saturated seconds | Saturation percentage |
|---|---|---|---|
| A | 145969 | 6025 | 4.127589% |
| B | 145970 | 3541 | 2.425841% |
| C | 145970 | 1789 | 1.225594% |
| D | 145970 | 14956 | 10.245941% |
Noise dominated data is calculated using 1-second bins in cleaned event files. If a bin has >2000 counts, and if more than 50% of those come from <1% of pixels, then it is considered to be noise-dominated and hence unusable.
| Quadrant | # 1 sec bins | Bins with >0 counts | Bins with >2000 counts | High rate bins dominated by noise | Noise dominated (total time) | Noise dominated (detector-on time) | Marked lightcurve |
|---|---|---|---|---|---|---|---|
| A | 164104 | 145947 | 0 | 0 | 0.00% | 0.00% |  |
| B | 164105 | 145956 | 0 | 0 | 0.00% | 0.00% |  |
| C | 164105 | 145924 | 0 | 0 | 0.00% | 0.00% |  |
| D | 164105 | 144909 | 0 | 0 | 0.00% | 0.00% |  |
Top three noisy pixels from each quadrant. If the there are fewer than three noisy pixels in the level2.evt file, extra rows are filled as -1
| Pixel properties | Quadrant properties | ||||||
|---|---|---|---|---|---|---|---|
| Quadrant | DetID | PixID | Counts | Sigma | Mean | Median | Sigma |
| A | 7 | 110 | 6010 | 8.3 | 1972 | 1849 | 501.4 |
| A | 15 | 236 | 5872 | 8.02 | 1972 | 1849 | 501.4 |
| A | 0 | 29 | 5786 | 7.85 | 1972 | 1849 | 501.4 |
| B | 2 | 9 | 7009 | 13.63 | 1961 | 1873 | 376.8 |
| B | 2 | 8 | 5614 | 9.93 | 1961 | 1873 | 376.8 |
| B | 3 | 17 | 5201 | 8.83 | 1961 | 1873 | 376.8 |
| C | 3 | 202 | 6018 | 7.93 | 2017 | 1879 | 522.0 |
| C | 1 | 81 | 5899 | 7.7 | 2017 | 1879 | 522.0 |
| C | 3 | 203 | 5783 | 7.48 | 2017 | 1879 | 522.0 |
| D | 15 | 47 | 4634 | 6.09 | 1782 | 1617 | 495.2 |
| D | 4 | 16 | 4591 | 6.01 | 1782 | 1617 | 495.2 |
| D | 6 | 38 | 4542 | 5.91 | 1782 | 1617 | 495.2 |
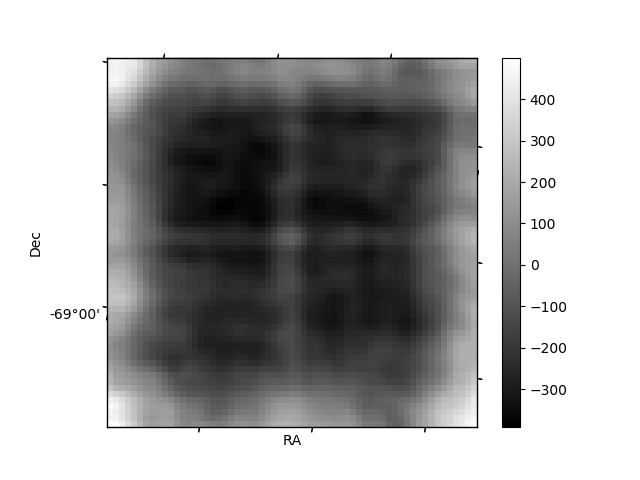
Histogram calculated using DETX and DETY for each event in the final _common_clean file
| Quadrant A |  |
 |
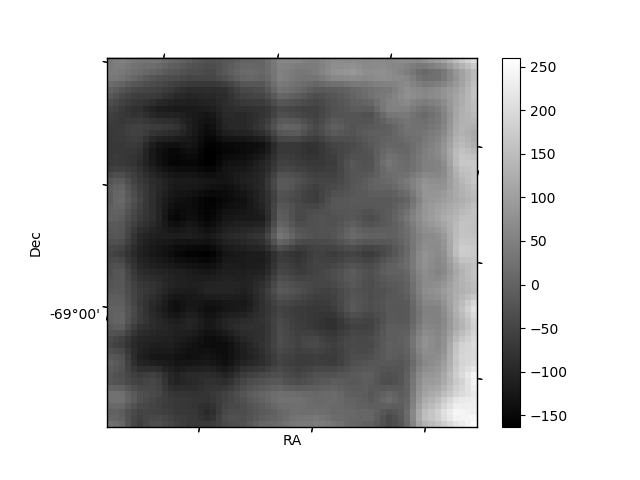
Quadrant B |
|---|---|---|---|
| Quadrant D |  |
 |
Quadrant C |
| Plot type | Count rate plots | Images |
|---|---|---|
| Comparison with Poisson distribution Blue bars denote a histogram of data divided into 1 sec bins. Red curve is a Poisson curve with rate = median count rate of data. |
 |
 |
| Quadrant-wise count rates Data is divided into 100 sec bins |
 |
|
| Module-wise count rates for Quadrant A Data is divided into 100 sec bins |
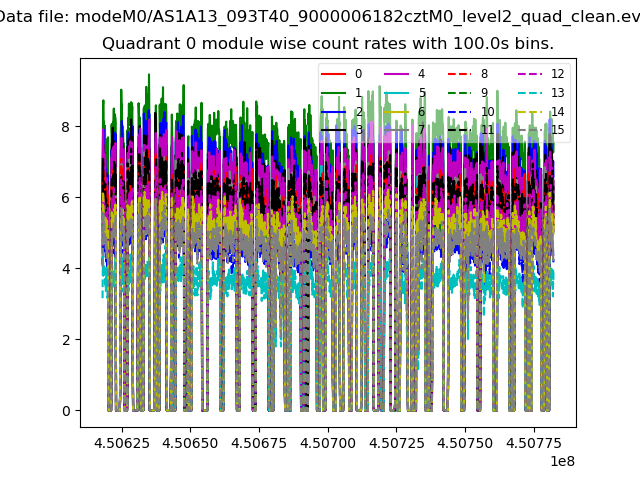 |
 |
| Module-wise count rates for Quadrant B Data is divided into 100 sec bins |
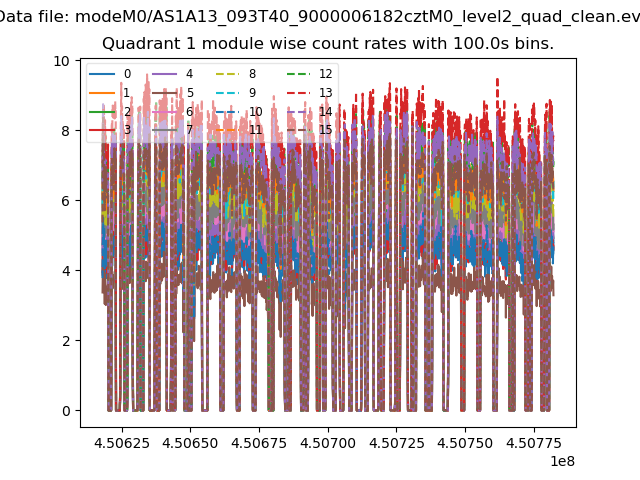 |
 |
| Module-wise count rates for Quadrant C Data is divided into 100 sec bins |
 |
 |
| Module-wise count rates for Quadrant D Data is divided into 100 sec bins |
 |
 |
| Parameter | Plot |
|---|---|
| CZT HV Monitor |  |
| D_VDD |  |
| Temperature 1 |  |
| Veto HV Monitor |  |
| Veto LLD |  |
| Alpha Counter | 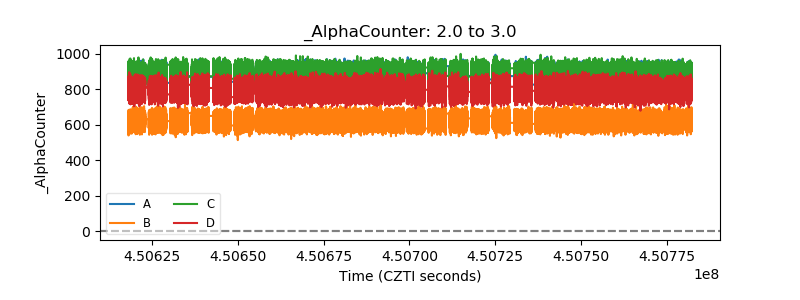 |
| _CPM_Rate |  |
| CZT Counter |  |
| +2.5 Volts monitor |  |
| +5 Volts monitor |  |
| _ROLL_ROT |  |
| _Roll_DEC | 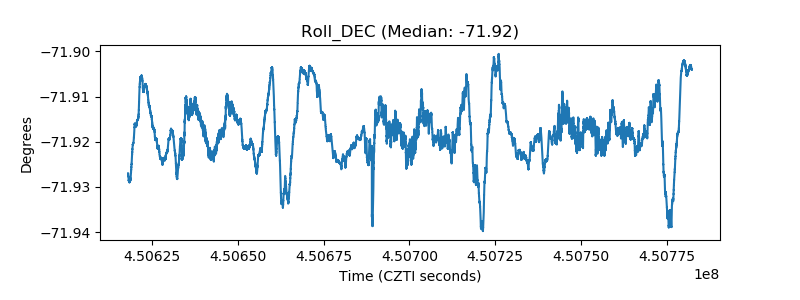 |
| _Roll_RA |  |
| Veto Counter |  |