| Param | Original file | Final file |
|---|---|---|
| Filename | modeM0/AS1T05_194T01_9000006180cztM0_level2.fits | modeM0/AS1T05_194T01_9000006180cztM0_level2_quad_clean.evt |
| Size (bytes) | 737,864,640 | 915,261,120 |
| Size | 703.7 MB | 872.9 MB |
| Events in quadrant A | 4,400,766 | 5,931,714 |
| Events in quadrant B | 4,281,220 | 5,980,075 |
| Events in quadrant C | 4,217,510 | 5,244,700 |
| Events in quadrant D | 3,549,542 | 4,677,222 |
| Mode M9 | |||
|---|---|---|---|
| Quadrant | BADHDUFLAG | Total packets | Discarded packets |
| A | 0 | 99 | 0 |
| B | 0 | 99 | 0 |
| C | 0 | 99 | 0 |
| D | 0 | 99 | 0 |
| Mode SS | |||
|---|---|---|---|
| Quadrant | BADHDUFLAG | Total packets | Discarded packets |
| A | 0 | 1746 | 0 |
| B | 0 | 1746 | 0 |
| C | 0 | 1746 | 0 |
| D | 0 | 1746 | 0 |
| Mode M0 | |||
|---|---|---|---|
| Quadrant | BADHDUFLAG | Total packets | Discarded packets |
| A | 0 | 277711 | 0 |
| B | 0 | 223466 | 0 |
| C | 0 | 249852 | 0 |
| D | 0 | 302225 | 0 |
| Quadrant | Total seconds | Saturated seconds | Saturation percentage |
|---|---|---|---|
| A | 85854 | 2795 | 3.255527% |
| B | 85853 | 3342 | 3.892700% |
| C | 85855 | 9010 | 10.494438% |
| D | 85855 | 11078 | 12.903151% |
Noise dominated data is calculated using 1-second bins in cleaned event files. If a bin has >2000 counts, and if more than 50% of those come from <1% of pixels, then it is considered to be noise-dominated and hence unusable.
| Quadrant | # 1 sec bins | Bins with >0 counts | Bins with >2000 counts | High rate bins dominated by noise | Noise dominated (total time) | Noise dominated (detector-on time) | Marked lightcurve |
|---|---|---|---|---|---|---|---|
| A | 95654 | 85849 | 0 | 0 | 0.00% | 0.00% |  |
| B | 95655 | 85838 | 0 | 0 | 0.00% | 0.00% |  |
| C | 95655 | 85793 | 0 | 0 | 0.00% | 0.00% |  |
| D | 95655 | 85460 | 0 | 0 | 0.00% | 0.00% |  |
Top three noisy pixels from each quadrant. If the there are fewer than three noisy pixels in the level2.evt file, extra rows are filled as -1
| Pixel properties | Quadrant properties | ||||||
|---|---|---|---|---|---|---|---|
| Quadrant | DetID | PixID | Counts | Sigma | Mean | Median | Sigma |
| A | 7 | 110 | 3566 | 8.54 | 1144 | 1070 | 292.4 |
| A | 0 | 29 | 3401 | 7.97 | 1144 | 1070 | 292.4 |
| A | 15 | 236 | 3369 | 7.86 | 1144 | 1070 | 292.4 |
| B | 2 | 9 | 3955 | 12.76 | 1129 | 1073 | 225.9 |
| B | 2 | 8 | 3198 | 9.41 | 1129 | 1073 | 225.9 |
| B | 3 | 17 | 2971 | 8.4 | 1129 | 1073 | 225.9 |
| C | 3 | 203 | 3242 | 7.64 | 1116 | 1037 | 288.6 |
| C | 1 | 81 | 3225 | 7.58 | 1116 | 1037 | 288.6 |
| C | 3 | 202 | 3188 | 7.45 | 1116 | 1037 | 288.6 |
| D | 15 | 47 | 2667 | 6.13 | 1018 | 922 | 284.4 |
| D | 10 | 189 | 2614 | 5.95 | 1018 | 922 | 284.4 |
| D | 4 | 250 | 2586 | 5.85 | 1018 | 922 | 284.4 |
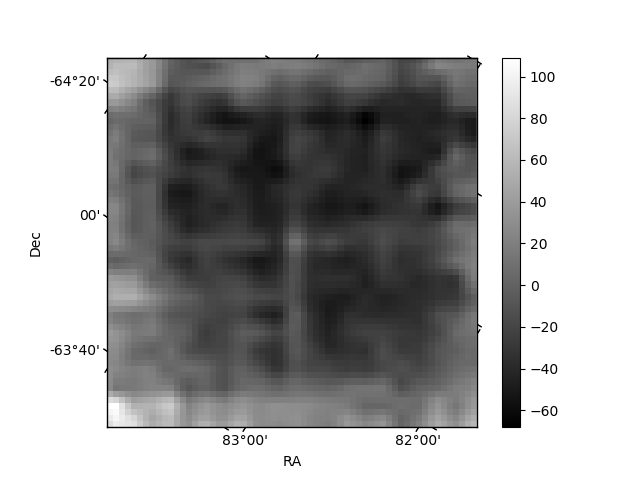
Histogram calculated using DETX and DETY for each event in the final _common_clean file
| Quadrant A |  |
 |
Quadrant B |
|---|---|---|---|
| Quadrant D |  |
 |
Quadrant C |
| Plot type | Count rate plots | Images |
|---|---|---|
| Comparison with Poisson distribution Blue bars denote a histogram of data divided into 1 sec bins. Red curve is a Poisson curve with rate = median count rate of data. |
 |
 |
| Quadrant-wise count rates Data is divided into 100 sec bins |
 |
|
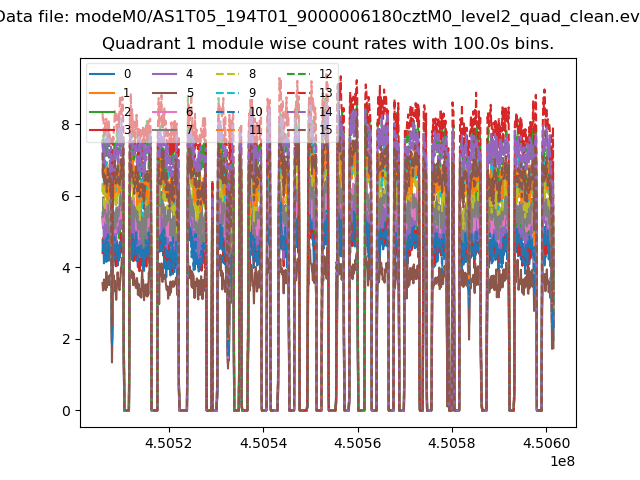
| Module-wise count rates for Quadrant A Data is divided into 100 sec bins |
 |
 |
| Module-wise count rates for Quadrant B Data is divided into 100 sec bins |
 |
 |
| Module-wise count rates for Quadrant C Data is divided into 100 sec bins |
 |
 |
| Module-wise count rates for Quadrant D Data is divided into 100 sec bins |
 |
 |
| Parameter | Plot |
|---|---|
| CZT HV Monitor | 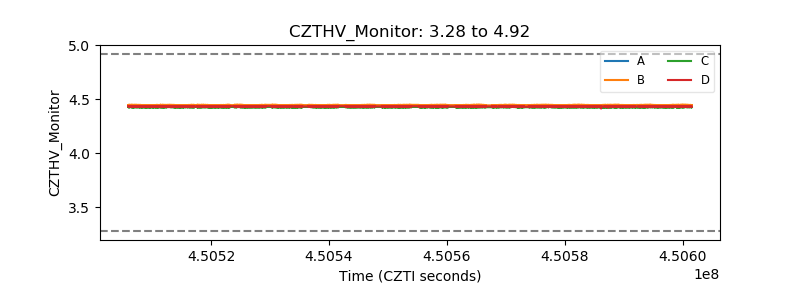 |
| D_VDD |  |
| Temperature 1 |  |
| Veto HV Monitor | 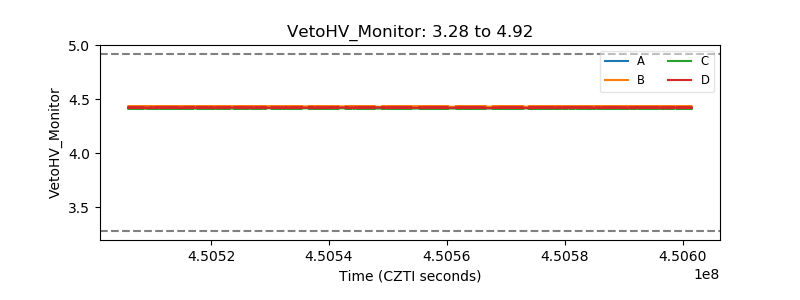 |
| Veto LLD |  |
| Alpha Counter | 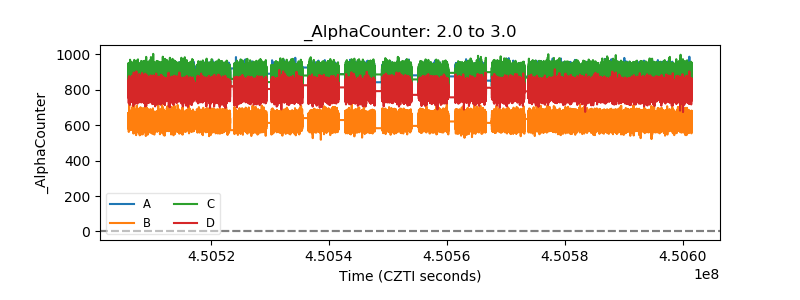 |
| _CPM_Rate |  |
| CZT Counter |  |
| +2.5 Volts monitor |  |
| +5 Volts monitor | 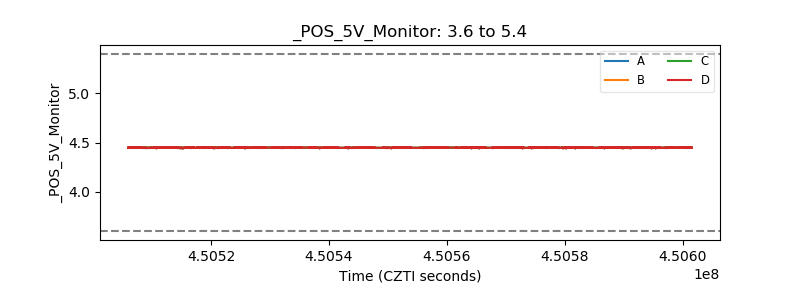 |
| _ROLL_ROT | 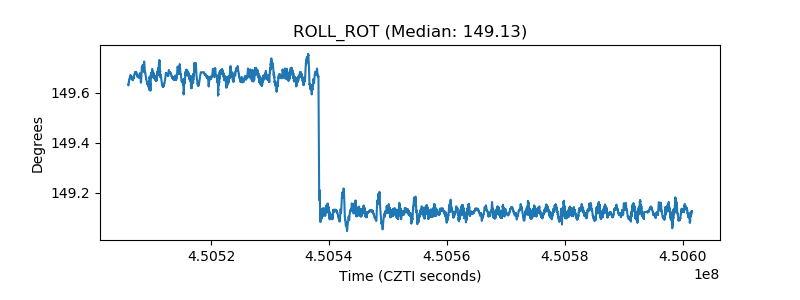 |
| _Roll_DEC | 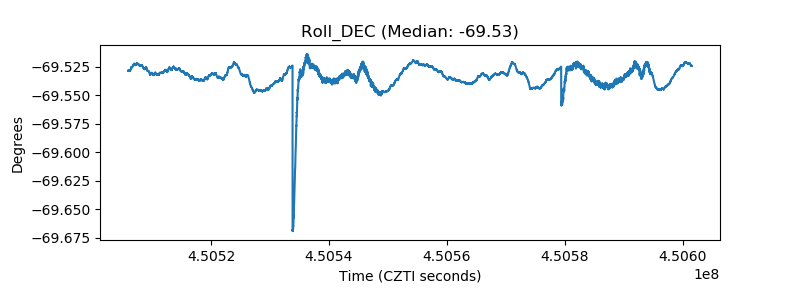 |
| _Roll_RA |  |
| Veto Counter |  |