| Param | Original file | Final file |
|---|---|---|
| Filename | modeM0/AS1A13_092T16_9000006178cztM0_level2.fits | modeM0/AS1A13_092T16_9000006178cztM0_level2_quad_clean.evt |
| Size (bytes) | 283,962,240 | 265,524,480 |
| Size | 270.8 MB | 253.2 MB |
| Events in quadrant A | 1,700,944 | 1,595,380 |
| Events in quadrant B | 1,683,734 | 1,627,748 |
| Events in quadrant C | 1,590,598 | 1,319,091 |
| Events in quadrant D | 1,392,526 | 1,269,942 |
| Mode M0 | |||
|---|---|---|---|
| Quadrant | BADHDUFLAG | Total packets | Discarded packets |
| A | 0 | 106029 | 0 |
| B | 0 | 73534 | 0 |
| C | 0 | 121751 | 0 |
| D | 0 | 107732 | 0 |
| Mode M9 | |||
|---|---|---|---|
| Quadrant | BADHDUFLAG | Total packets | Discarded packets |
| A | 0 | 37 | 0 |
| B | 0 | 37 | 0 |
| C | 0 | 37 | 0 |
| D | 0 | 37 | 0 |
| Mode SS | |||
|---|---|---|---|
| Quadrant | BADHDUFLAG | Total packets | Discarded packets |
| A | 0 | 656 | 0 |
| B | 0 | 656 | 0 |
| C | 0 | 656 | 0 |
| D | 0 | 656 | 0 |
| Quadrant | Total seconds | Saturated seconds | Saturation percentage |
|---|---|---|---|
| A | 32418 | 751 | 2.316614% |
| B | 32418 | 369 | 1.138257% |
| C | 32418 | 5710 | 17.613671% |
| D | 32419 | 3785 | 11.675252% |
Noise dominated data is calculated using 1-second bins in cleaned event files. If a bin has >2000 counts, and if more than 50% of those come from <1% of pixels, then it is considered to be noise-dominated and hence unusable.
| Quadrant | # 1 sec bins | Bins with >0 counts | Bins with >2000 counts | High rate bins dominated by noise | Noise dominated (total time) | Noise dominated (detector-on time) | Marked lightcurve |
|---|---|---|---|---|---|---|---|
| A | 36118 | 32419 | 0 | 0 | 0.00% | 0.00% |  |
| B | 36118 | 32419 | 0 | 0 | 0.00% | 0.00% | 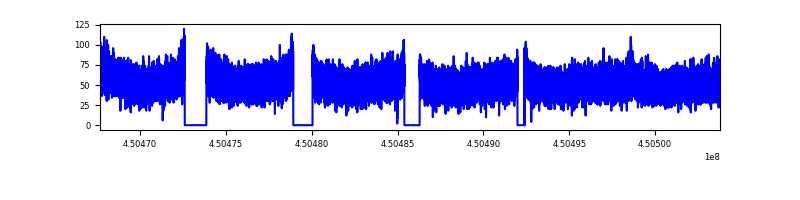 |
| C | 36117 | 32399 | 0 | 0 | 0.00% | 0.00% |  |
| D | 36119 | 32363 | 0 | 0 | 0.00% | 0.00% | 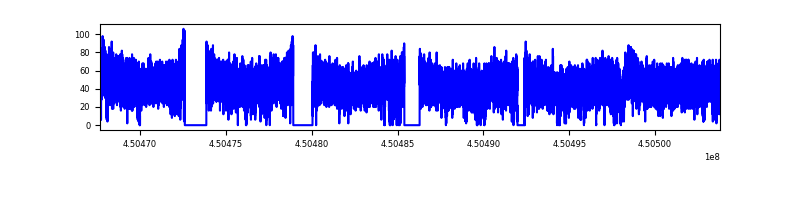 |
Top three noisy pixels from each quadrant. If the there are fewer than three noisy pixels in the level2.evt file, extra rows are filled as -1
| Pixel properties | Quadrant properties | ||||||
|---|---|---|---|---|---|---|---|
| Quadrant | DetID | PixID | Counts | Sigma | Mean | Median | Sigma |
| A | 15 | 236 | 1383 | 8.46 | 443 | 412 | 114.7 |
| A | 7 | 110 | 1374 | 8.39 | 443 | 412 | 114.7 |
| A | 0 | 29 | 1365 | 8.31 | 443 | 412 | 114.7 |
| B | 2 | 9 | 1567 | 13.0 | 442 | 420 | 88.3 |
| B | 2 | 8 | 1263 | 9.55 | 442 | 420 | 88.3 |
| B | 3 | 17 | 1193 | 8.76 | 442 | 420 | 88.3 |
| C | 1 | 81 | 1257 | 7.78 | 420 | 390 | 111.4 |
| C | 1 | 80 | 1227 | 7.51 | 420 | 390 | 111.4 |
| C | 3 | 202 | 1223 | 7.47 | 420 | 390 | 111.4 |
| D | 8 | 176 | 1198 | 7.42 | 399 | 362 | 112.7 |
| D | 12 | 6 | 1065 | 6.24 | 399 | 362 | 112.7 |
| D | 7 | 3 | 1041 | 6.03 | 399 | 362 | 112.7 |
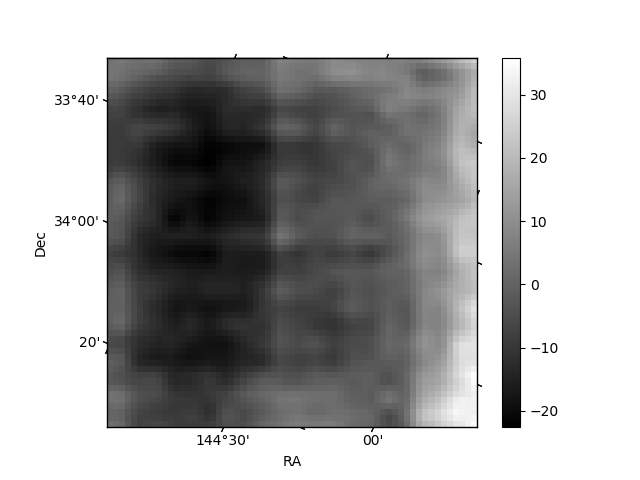
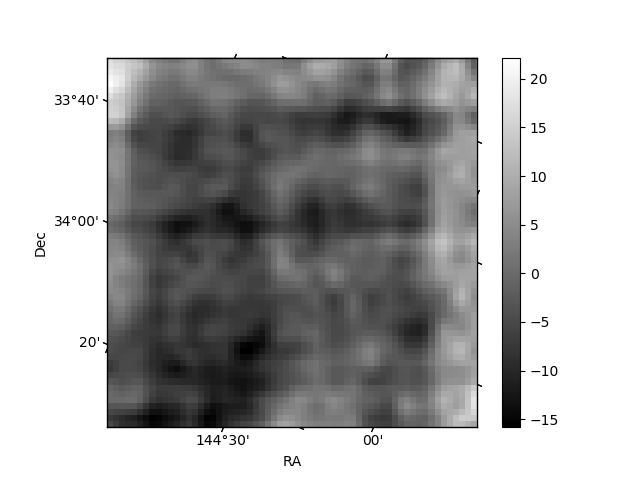
Histogram calculated using DETX and DETY for each event in the final _common_clean file
| Quadrant A | 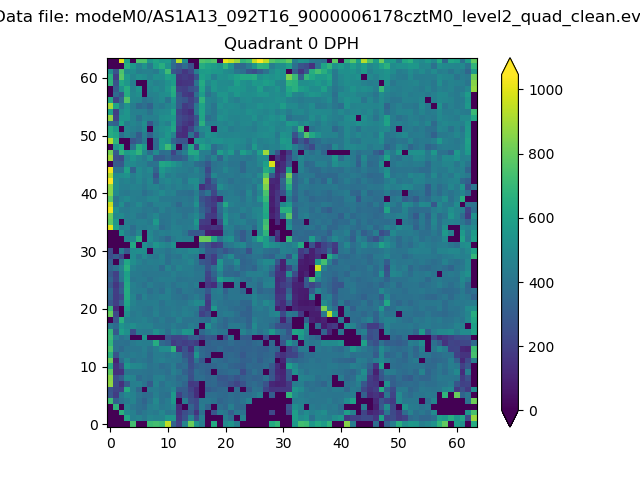 |
 |
Quadrant B |
|---|---|---|---|
| Quadrant D |  |
 |
Quadrant C |
| Plot type | Count rate plots | Images |
|---|---|---|
| Comparison with Poisson distribution Blue bars denote a histogram of data divided into 1 sec bins. Red curve is a Poisson curve with rate = median count rate of data. |
 |
 |
| Quadrant-wise count rates Data is divided into 100 sec bins |
 |
|
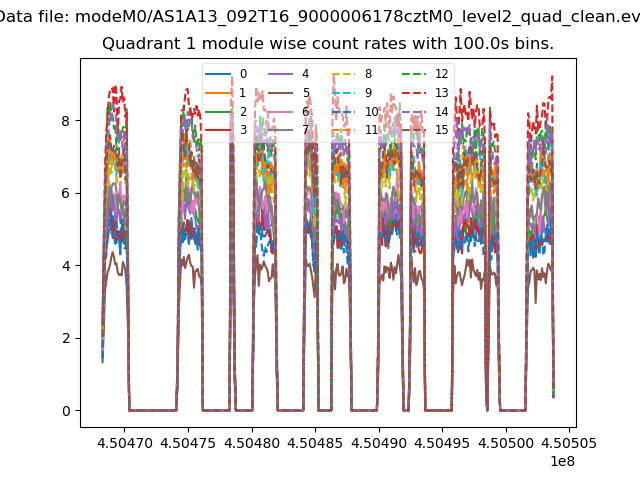
| Module-wise count rates for Quadrant A Data is divided into 100 sec bins |
 |
 |
| Module-wise count rates for Quadrant B Data is divided into 100 sec bins |
 |
 |
| Module-wise count rates for Quadrant C Data is divided into 100 sec bins |
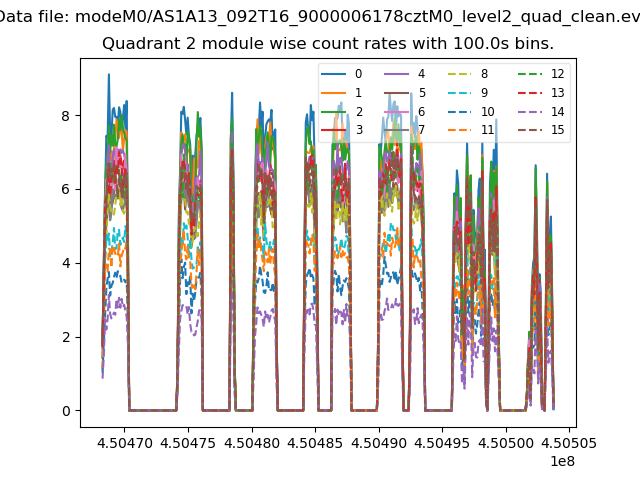 |
 |
| Module-wise count rates for Quadrant D Data is divided into 100 sec bins |
 |
 |
| Parameter | Plot |
|---|---|
| CZT HV Monitor | 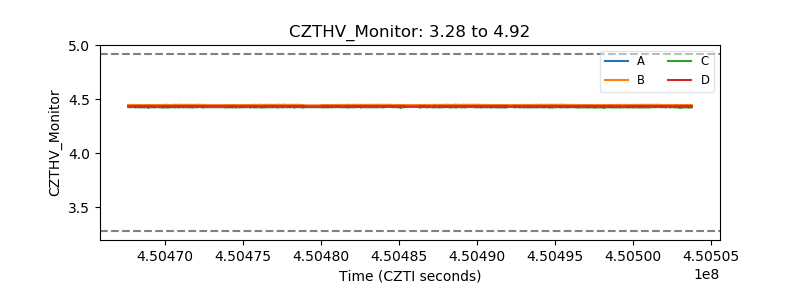 |
| D_VDD | 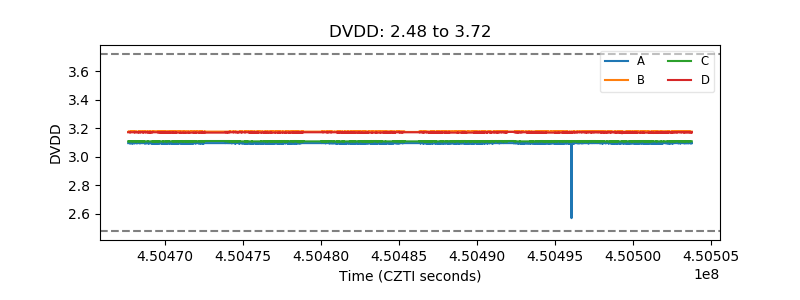 |
| Temperature 1 | 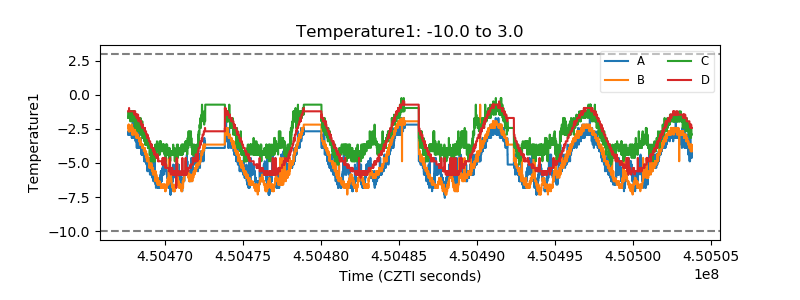 |
| Veto HV Monitor |  |
| Veto LLD |  |
| Alpha Counter |  |
| _CPM_Rate |  |
| CZT Counter |  |
| +2.5 Volts monitor |  |
| +5 Volts monitor |  |
| _ROLL_ROT |  |
| _Roll_DEC |  |
| _Roll_RA | 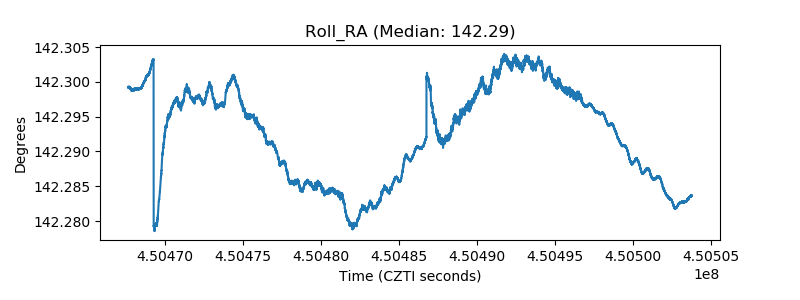 |
| Veto Counter |  |