| Param | Original file | Final file |
|---|---|---|
| Filename | modeM0/AS1A13_092T03_9000006176cztM0_level2.fits | modeM0/AS1A13_092T03_9000006176cztM0_level2_quad_clean.evt |
| Size (bytes) | 175,291,200 | 144,708,480 |
| Size | 167.2 MB | 138.0 MB |
| Events in quadrant A | 1,235,136 | 992,874 |
| Events in quadrant B | 224,734 | 93,967 |
| Events in quadrant C | 1,161,224 | 815,027 |
| Events in quadrant D | 1,048,742 | 853,127 |
| Mode M0 | |||
|---|---|---|---|
| Quadrant | BADHDUFLAG | Total packets | Discarded packets |
| A | 0 | 77000 | 0 |
| B | 0 | 194219 | 0 |
| C | 0 | 74464 | 0 |
| D | 0 | 68832 | 0 |
| Mode SS | |||
|---|---|---|---|
| Quadrant | BADHDUFLAG | Total packets | Discarded packets |
| A | 0 | 482 | 0 |
| B | 0 | 482 | 0 |
| C | 0 | 482 | 0 |
| D | 0 | 482 | 0 |
| Mode M9 | |||
|---|---|---|---|
| Quadrant | BADHDUFLAG | Total packets | Discarded packets |
| A | 0 | 44 | 0 |
| B | 0 | 44 | 0 |
| C | 0 | 44 | 0 |
| D | 0 | 44 | 0 |
| Quadrant | Total seconds | Saturated seconds | Saturation percentage |
|---|---|---|---|
| A | 23625 | 881 | 3.729101% |
| B | 23625 | 21392 | 90.548148% |
| C | 23625 | 3757 | 15.902646% |
| D | 23625 | 1702 | 7.204233% |
Noise dominated data is calculated using 1-second bins in cleaned event files. If a bin has >2000 counts, and if more than 50% of those come from <1% of pixels, then it is considered to be noise-dominated and hence unusable.
| Quadrant | # 1 sec bins | Bins with >0 counts | Bins with >2000 counts | High rate bins dominated by noise | Noise dominated (total time) | Noise dominated (detector-on time) | Marked lightcurve |
|---|---|---|---|---|---|---|---|
| A | 27990 | 23625 | 0 | 0 | 0.00% | 0.00% |  |
| B | 27990 | 15419 | 0 | 0 | 0.00% | 0.00% |  |
| C | 27990 | 23618 | 0 | 0 | 0.00% | 0.00% |  |
| D | 27990 | 23615 | 0 | 0 | 0.00% | 0.00% |  |
Top three noisy pixels from each quadrant. If the there are fewer than three noisy pixels in the level2.evt file, extra rows are filled as -1
| Pixel properties | Quadrant properties | ||||||
|---|---|---|---|---|---|---|---|
| Quadrant | DetID | PixID | Counts | Sigma | Mean | Median | Sigma |
| A | 0 | 29 | 1011 | 8.5 | 321 | 301 | 83.5 |
| A | 7 | 110 | 1009 | 8.48 | 321 | 301 | 83.5 |
| A | 0 | 30 | 950 | 7.77 | 321 | 301 | 83.5 |
| B | 2 | 9 | 202 | 10.44 | 59 | 57 | 13.9 |
| B | 2 | 8 | 183 | 9.07 | 59 | 57 | 13.9 |
| B | 5 | 128 | 183 | 9.07 | 59 | 57 | 13.9 |
| C | 1 | 81 | 884 | 7.28 | 307 | 285 | 82.2 |
| C | 3 | 202 | 858 | 6.97 | 307 | 285 | 82.2 |
| C | 1 | 80 | 847 | 6.83 | 307 | 285 | 82.2 |
| D | 7 | 3 | 792 | 6.14 | 300 | 273 | 84.5 |
| D | 6 | 38 | 791 | 6.13 | 300 | 273 | 84.5 |
| D | 4 | 250 | 786 | 6.07 | 300 | 273 | 84.5 |
Histogram calculated using DETX and DETY for each event in the final _common_clean file
| Quadrant A | 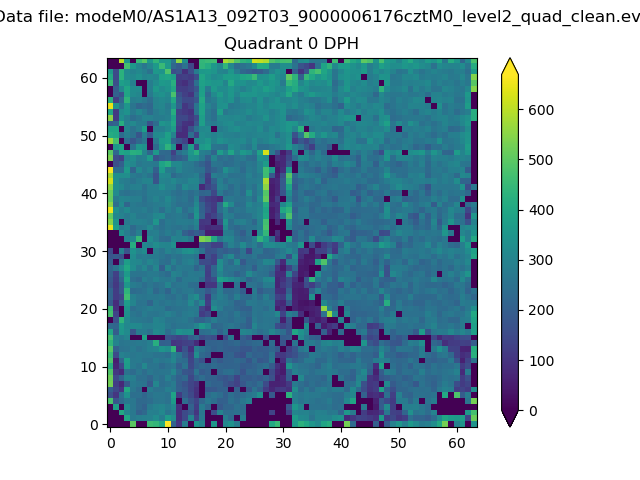 |
 |
Quadrant B |
|---|---|---|---|
| Quadrant D |  |
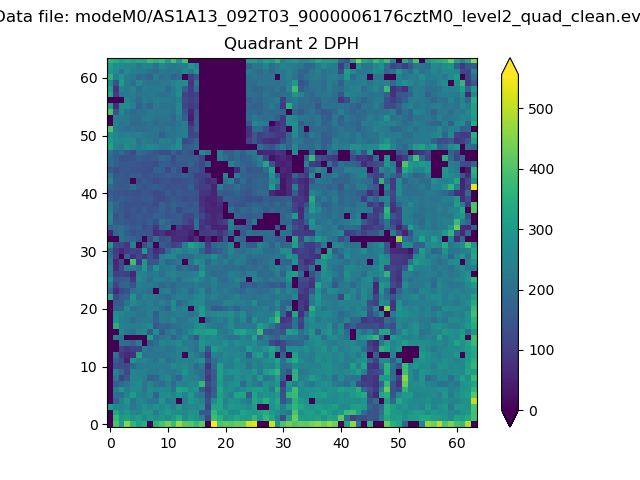 |
Quadrant C |
| Plot type | Count rate plots | Images |
|---|---|---|
| Comparison with Poisson distribution Blue bars denote a histogram of data divided into 1 sec bins. Red curve is a Poisson curve with rate = median count rate of data. |
 |
 |
| Quadrant-wise count rates Data is divided into 100 sec bins |
 |
|
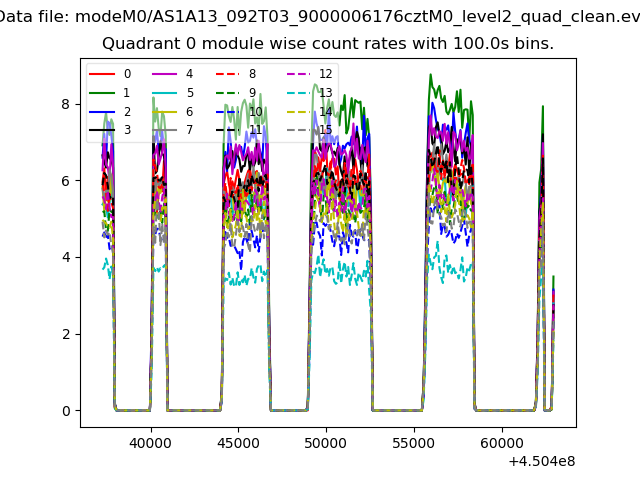
| Module-wise count rates for Quadrant A Data is divided into 100 sec bins |
 |
 |
| Module-wise count rates for Quadrant B Data is divided into 100 sec bins |
 |
 |
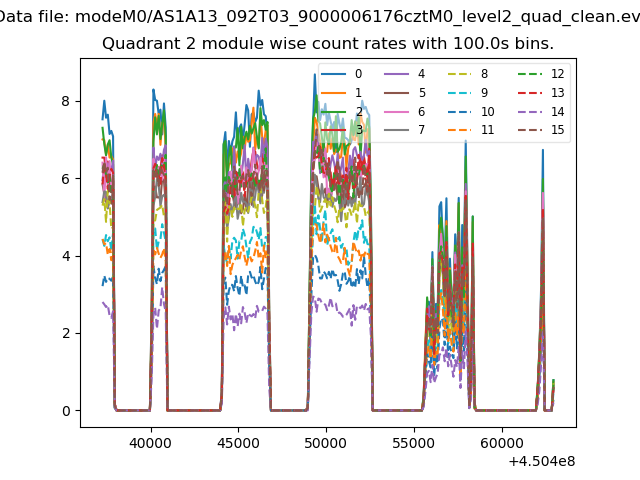
| Module-wise count rates for Quadrant C Data is divided into 100 sec bins |
 |
 |
| Module-wise count rates for Quadrant D Data is divided into 100 sec bins |
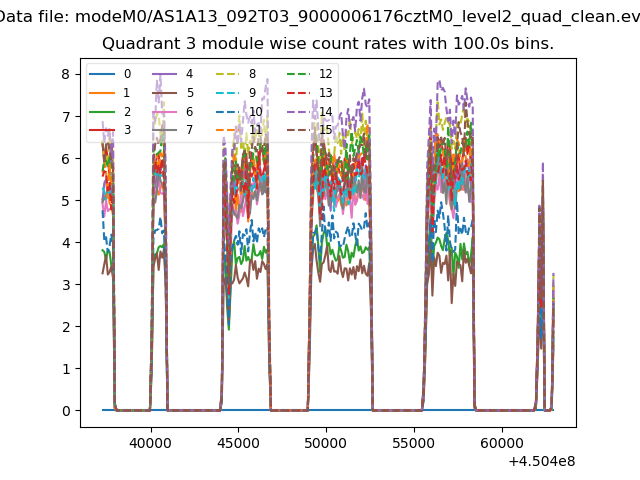 |
 |
| Parameter | Plot |
|---|---|
| CZT HV Monitor | 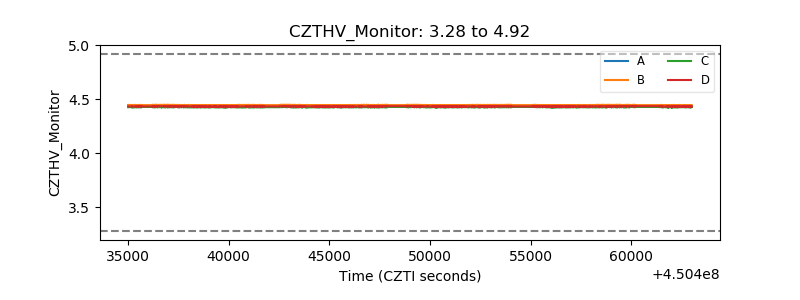 |
| D_VDD |  |
| Temperature 1 |  |
| Veto HV Monitor |  |
| Veto LLD | 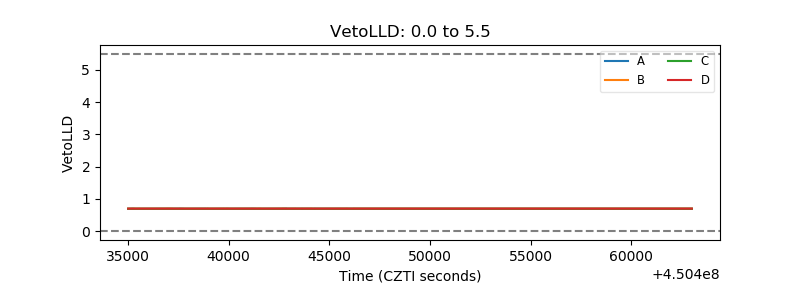 |
| Alpha Counter |  |
| _CPM_Rate |  |
| CZT Counter |  |
| +2.5 Volts monitor |  |
| +5 Volts monitor | 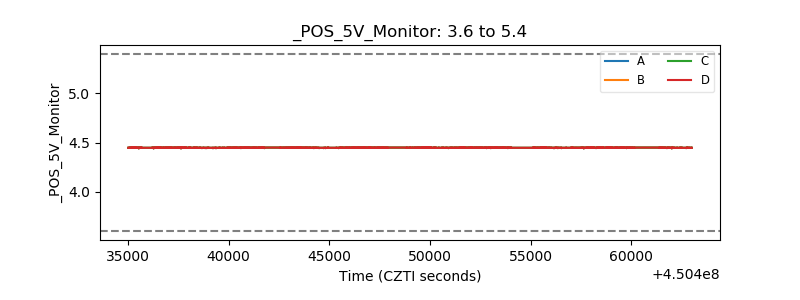 |
| _ROLL_ROT |  |
| _Roll_DEC |  |
| _Roll_RA |  |
| Veto Counter |  |