| Param | Original file | Final file |
|---|---|---|
| Filename | modeM0/AS1A13_098T02_9000006174cztM0_level2.fits | modeM0/AS1A13_098T02_9000006174cztM0_level2_quad_clean.evt |
| Size (bytes) | 881,328,960 | 862,286,400 |
| Size | 840.5 MB | 822.3 MB |
| Events in quadrant A | 5,212,896 | 5,121,422 |
| Events in quadrant B | 5,041,096 | 5,136,352 |
| Events in quadrant C | 5,358,370 | 5,121,050 |
| Events in quadrant D | 4,140,858 | 3,809,319 |
| Mode M0 | |||
|---|---|---|---|
| Quadrant | BADHDUFLAG | Total packets | Discarded packets |
| A | 0 | 340377 | 0 |
| B | 0 | 270385 | 0 |
| C | 0 | 225473 | 0 |
| D | 0 | 396491 | 0 |
| Mode SS | |||
|---|---|---|---|
| Quadrant | BADHDUFLAG | Total packets | Discarded packets |
| A | 0 | 2040 | 0 |
| B | 0 | 2040 | 0 |
| C | 0 | 2040 | 0 |
| D | 0 | 2040 | 0 |
| Mode M9 | |||
|---|---|---|---|
| Quadrant | BADHDUFLAG | Total packets | Discarded packets |
| A | 1 | 140048426194984 | 140045998620718 |
| B | 1 | 140048426194984 | 140045998620718 |
| C | 1 | 140048426194984 | 140045998620718 |
| D | 1 | 140048426194984 | 140045998620718 |
| Quadrant | Total seconds | Saturated seconds | Saturation percentage |
|---|---|---|---|
| A | 101035 | 4266 | 4.222299% |
| B | 101034 | 5785 | 5.725795% |
| C | 101036 | 1872 | 1.852805% |
| D | 101036 | 18823 | 18.629993% |
Noise dominated data is calculated using 1-second bins in cleaned event files. If a bin has >2000 counts, and if more than 50% of those come from <1% of pixels, then it is considered to be noise-dominated and hence unusable.
| Quadrant | # 1 sec bins | Bins with >0 counts | Bins with >2000 counts | High rate bins dominated by noise | Noise dominated (total time) | Noise dominated (detector-on time) | Marked lightcurve |
|---|---|---|---|---|---|---|---|
| A | 110595 | 101032 | 0 | 0 | 0.00% | 0.00% | 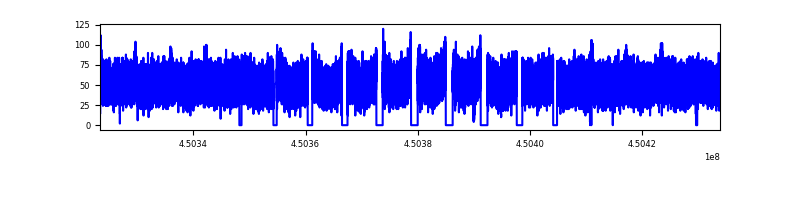 |
| B | 110594 | 100564 | 0 | 0 | 0.00% | 0.00% |  |
| C | 110595 | 101028 | 0 | 0 | 0.00% | 0.00% |  |
| D | 110595 | 100703 | 0 | 0 | 0.00% | 0.00% |  |
Top three noisy pixels from each quadrant. If the there are fewer than three noisy pixels in the level2.evt file, extra rows are filled as -1
| Pixel properties | Quadrant properties | ||||||
|---|---|---|---|---|---|---|---|
| Quadrant | DetID | PixID | Counts | Sigma | Mean | Median | Sigma |
| A | 7 | 110 | 4353 | 8.91 | 1355 | 1260 | 347.1 |
| A | 15 | 236 | 4159 | 8.35 | 1355 | 1260 | 347.1 |
| A | 0 | 29 | 4039 | 8.01 | 1355 | 1260 | 347.1 |
| B | 2 | 9 | 4844 | 13.7 | 1329 | 1258 | 261.7 |
| B | 2 | 8 | 3875 | 10.0 | 1329 | 1258 | 261.7 |
| B | 3 | 17 | 3699 | 9.33 | 1329 | 1258 | 261.7 |
| C | 1 | 81 | 3959 | 7.19 | 1415 | 1309 | 368.5 |
| C | 3 | 202 | 3938 | 7.13 | 1415 | 1309 | 368.5 |
| C | 1 | 80 | 3933 | 7.12 | 1415 | 1309 | 368.5 |
| D | 8 | 176 | 3225 | 6.32 | 1192 | 1076 | 340.2 |
| D | 15 | 47 | 3007 | 5.68 | 1192 | 1076 | 340.2 |
| D | 15 | 63 | 2987 | 5.62 | 1192 | 1076 | 340.2 |
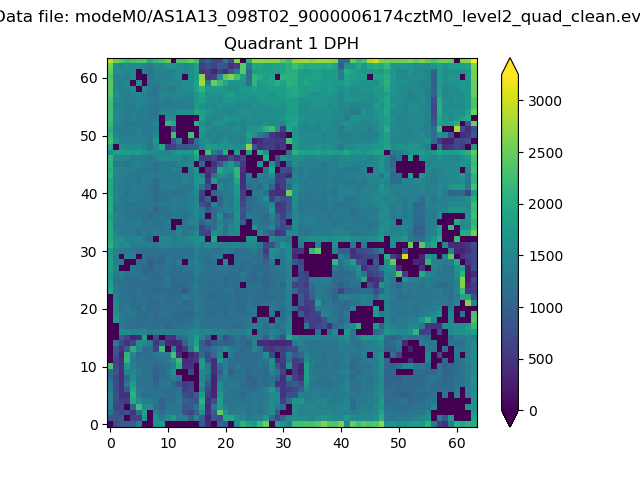
Histogram calculated using DETX and DETY for each event in the final _common_clean file
| Quadrant A |  |
 |
Quadrant B |
|---|---|---|---|
| Quadrant D |  |
 |
Quadrant C |
| Plot type | Count rate plots | Images |
|---|---|---|
| Comparison with Poisson distribution Blue bars denote a histogram of data divided into 1 sec bins. Red curve is a Poisson curve with rate = median count rate of data. |
 |
 |
| Quadrant-wise count rates Data is divided into 100 sec bins |
 |
|
| Module-wise count rates for Quadrant A Data is divided into 100 sec bins |
 |
 |
| Module-wise count rates for Quadrant B Data is divided into 100 sec bins |
 |
 |
| Module-wise count rates for Quadrant C Data is divided into 100 sec bins |
 |
 |
| Module-wise count rates for Quadrant D Data is divided into 100 sec bins |
 |
 |
| Parameter | Plot |
|---|---|
| CZT HV Monitor | 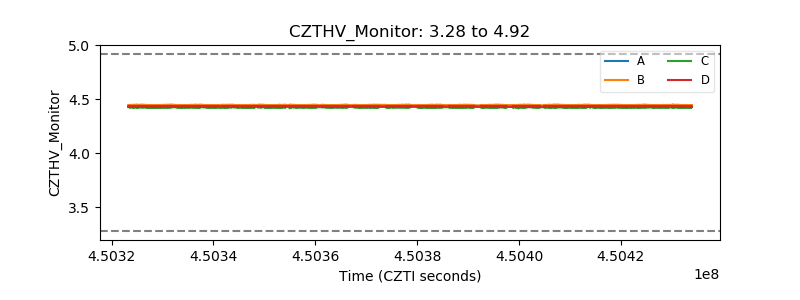 |
| D_VDD |  |
| Temperature 1 |  |
| Veto HV Monitor |  |
| Veto LLD |  |
| Alpha Counter |  |
| _CPM_Rate |  |
| CZT Counter |  |
| +2.5 Volts monitor |  |
| +5 Volts monitor |  |
| _ROLL_ROT | 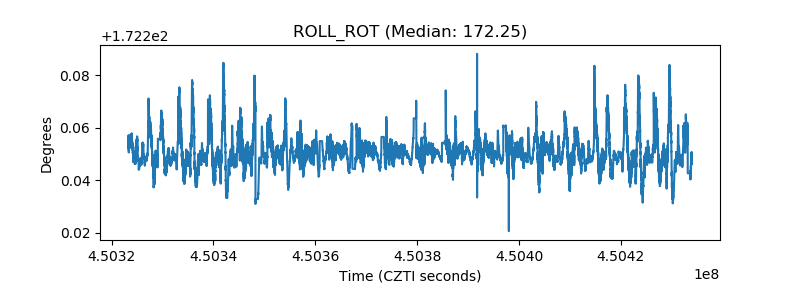 |
| _Roll_DEC |  |
| _Roll_RA |  |
| Veto Counter |  |