| Param | Original file | Final file |
|---|---|---|
| Filename | modeM0/AS1C07_001T10_9000006170cztM0_level2.fits | modeM0/AS1C07_001T10_9000006170cztM0_level2_quad_clean.evt |
| Size (bytes) | 822,493,440 | 984,758,400 |
| Size | 784.4 MB | 939.1 MB |
| Events in quadrant A | 5,042,098 | 6,531,616 |
| Events in quadrant B | 5,051,012 | 6,849,584 |
| Events in quadrant C | 5,245,146 | 6,737,662 |
| Events in quadrant D | 2,823,192 | 2,984,683 |
| Mode M0 | |||
|---|---|---|---|
| Quadrant | BADHDUFLAG | Total packets | Discarded packets |
| A | 0 | 317217 | 0 |
| B | 0 | 210725 | 0 |
| C | 0 | 207679 | 0 |
| D | 0 | 568279 | 0 |
| Mode SS | |||
|---|---|---|---|
| Quadrant | BADHDUFLAG | Total packets | Discarded packets |
| A | 0 | 1996 | 0 |
| B | 0 | 1996 | 0 |
| C | 0 | 1996 | 0 |
| D | 0 | 1996 | 0 |
| Mode M9 | |||
|---|---|---|---|
| Quadrant | BADHDUFLAG | Total packets | Discarded packets |
| A | 0 | 138 | 0 |
| B | 0 | 138 | 0 |
| C | 0 | 138 | 0 |
| D | 0 | 138 | 0 |
| Quadrant | Total seconds | Saturated seconds | Saturation percentage |
|---|---|---|---|
| A | 98037 | 2815 | 2.871365% |
| B | 98037 | 1484 | 1.513714% |
| C | 98037 | 1218 | 1.242388% |
| D | 98036 | 51920 | 52.960137% |
Noise dominated data is calculated using 1-second bins in cleaned event files. If a bin has >2000 counts, and if more than 50% of those come from <1% of pixels, then it is considered to be noise-dominated and hence unusable.
| Quadrant | # 1 sec bins | Bins with >0 counts | Bins with >2000 counts | High rate bins dominated by noise | Noise dominated (total time) | Noise dominated (detector-on time) | Marked lightcurve |
|---|---|---|---|---|---|---|---|
| A | 112117 | 98040 | 0 | 0 | 0.00% | 0.00% |  |
| B | 112117 | 98036 | 0 | 0 | 0.00% | 0.00% |  |
| C | 112117 | 98031 | 0 | 0 | 0.00% | 0.00% |  |
| D | 112116 | 91359 | 0 | 0 | 0.00% | 0.00% |  |
Top three noisy pixels from each quadrant. If the there are fewer than three noisy pixels in the level2.evt file, extra rows are filled as -1
| Pixel properties | Quadrant properties | ||||||
|---|---|---|---|---|---|---|---|
| Quadrant | DetID | PixID | Counts | Sigma | Mean | Median | Sigma |
| A | 7 | 110 | 4077 | 8.37 | 1316 | 1231 | 340.2 |
| A | 15 | 236 | 3953 | 8.0 | 1316 | 1231 | 340.2 |
| A | 0 | 29 | 3871 | 7.76 | 1316 | 1231 | 340.2 |
| B | 2 | 9 | 4804 | 13.65 | 1332 | 1270 | 259.0 |
| B | 2 | 8 | 3872 | 10.05 | 1332 | 1270 | 259.0 |
| B | 3 | 17 | 3667 | 9.26 | 1332 | 1270 | 259.0 |
| C | 3 | 202 | 4079 | 7.75 | 1387 | 1294 | 359.5 |
| C | 1 | 81 | 4067 | 7.71 | 1387 | 1294 | 359.5 |
| C | 3 | 203 | 4012 | 7.56 | 1387 | 1294 | 359.5 |
| D | 6 | 79 | 2109 | 6.08 | 810 | 737 | 225.8 |
| D | 15 | 47 | 2092 | 6.0 | 810 | 737 | 225.8 |
| D | 15 | 63 | 2059 | 5.86 | 810 | 737 | 225.8 |
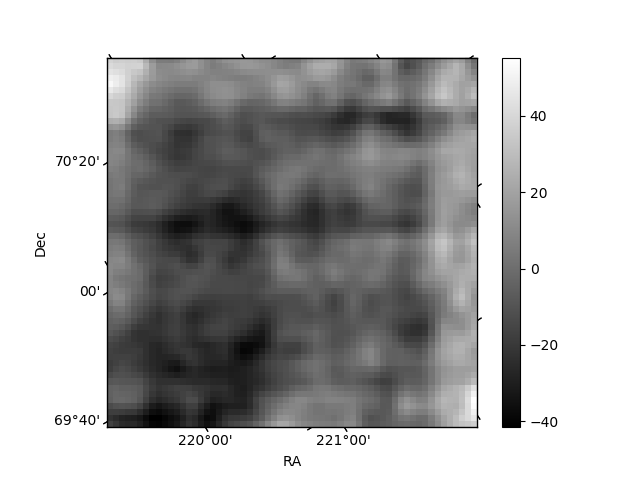
Histogram calculated using DETX and DETY for each event in the final _common_clean file
| Quadrant A |  |
 |
Quadrant B |
|---|---|---|---|
| Quadrant D | 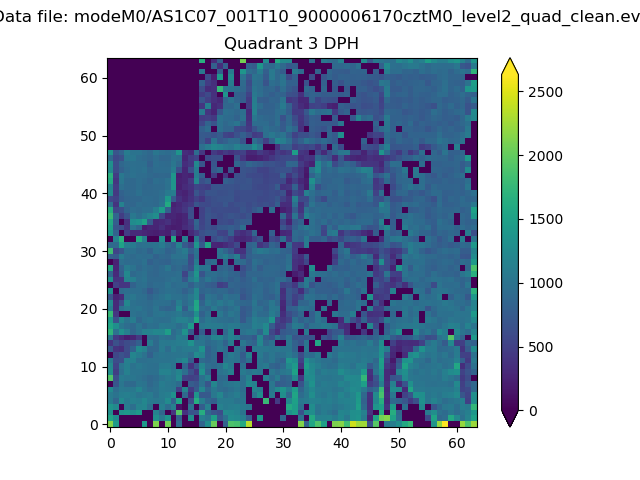 |
 |
Quadrant C |
| Plot type | Count rate plots | Images |
|---|---|---|
| Comparison with Poisson distribution Blue bars denote a histogram of data divided into 1 sec bins. Red curve is a Poisson curve with rate = median count rate of data. |
 |
 |
| Quadrant-wise count rates Data is divided into 100 sec bins |
 |
|
| Module-wise count rates for Quadrant A Data is divided into 100 sec bins |
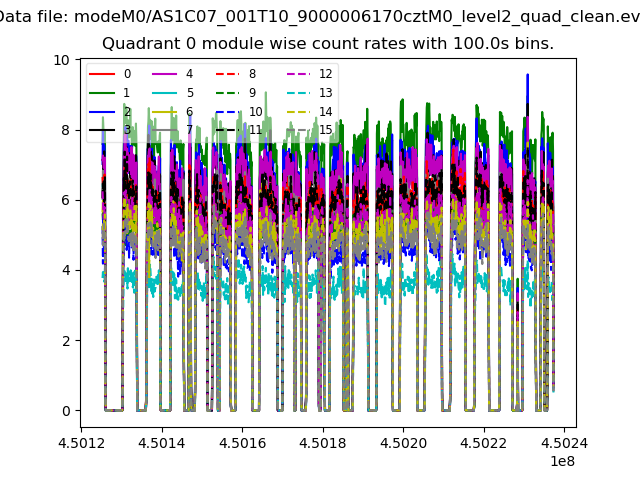 |
 |
| Module-wise count rates for Quadrant B Data is divided into 100 sec bins |
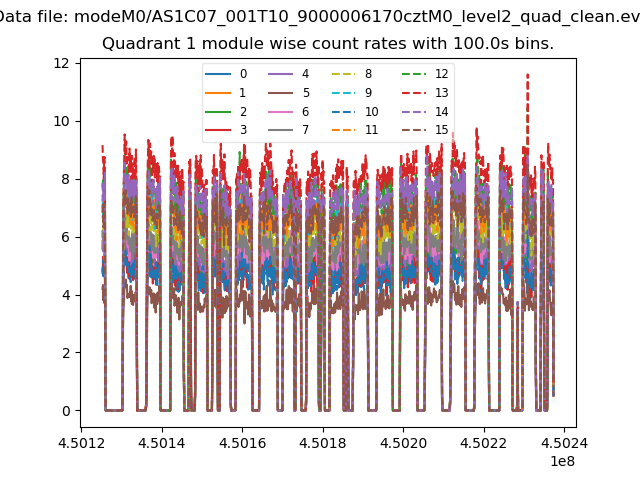 |
 |
| Module-wise count rates for Quadrant C Data is divided into 100 sec bins |
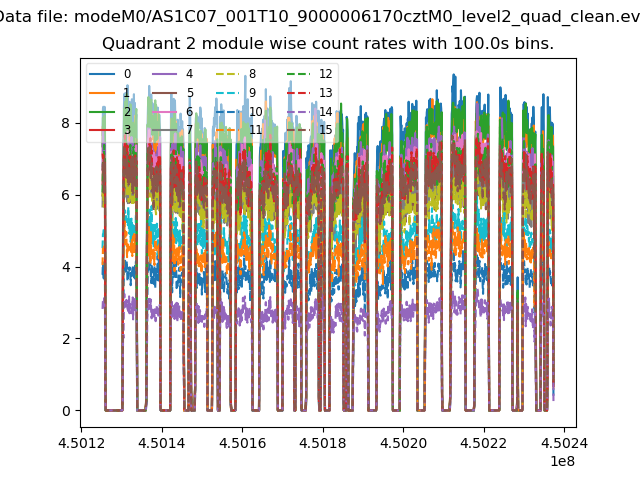 |
 |
| Module-wise count rates for Quadrant D Data is divided into 100 sec bins |
 |
 |
| Parameter | Plot |
|---|---|
| CZT HV Monitor | 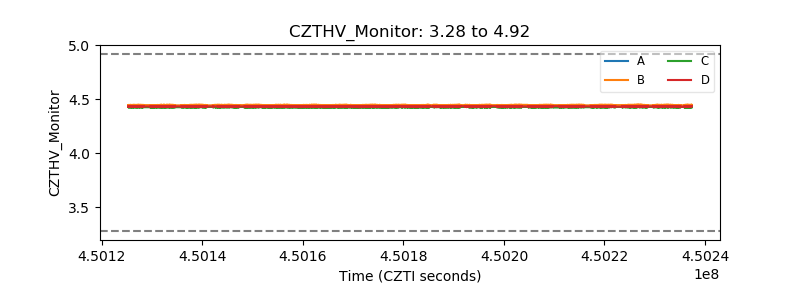 |
| D_VDD |  |
| Temperature 1 |  |
| Veto HV Monitor |  |
| Veto LLD |  |
| Alpha Counter |  |
| _CPM_Rate |  |
| CZT Counter | 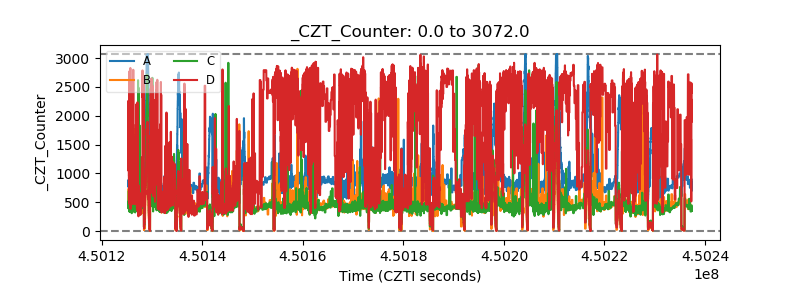 |
| +2.5 Volts monitor |  |
| +5 Volts monitor |  |
| _ROLL_ROT | 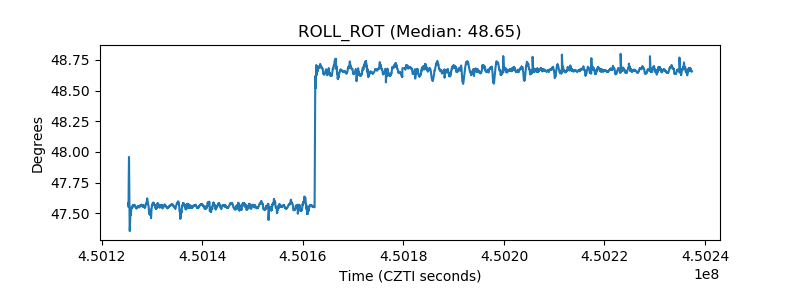 |
| _Roll_DEC |  |
| _Roll_RA |  |
| Veto Counter |  |