| Param | Original file | Final file |
|---|---|---|
| Filename | modeM0/AS1A13_033T02_9000006154cztM0_level2.fits | modeM0/AS1A13_033T02_9000006154cztM0_level2_quad_clean.evt |
| Size (bytes) | 480,156,480 | 502,966,080 |
| Size | 457.9 MB | 479.7 MB |
| Events in quadrant A | 2,861,620 | 3,042,677 |
| Events in quadrant B | 2,545,386 | 2,667,017 |
| Events in quadrant C | 2,934,626 | 3,076,122 |
| Events in quadrant D | 2,496,554 | 2,749,253 |
| Mode M9 | |||
|---|---|---|---|
| Quadrant | BADHDUFLAG | Total packets | Discarded packets |
| A | 0 | 77 | 0 |
| B | 0 | 77 | 0 |
| C | 0 | 77 | 0 |
| D | 0 | 77 | 0 |
| Mode SS | |||
|---|---|---|---|
| Quadrant | BADHDUFLAG | Total packets | Discarded packets |
| A | 0 | 1090 | 0 |
| B | 0 | 1090 | 0 |
| C | 0 | 1088 | 0 |
| D | 0 | 1089 | 0 |
| Mode M0 | |||
|---|---|---|---|
| Quadrant | BADHDUFLAG | Total packets | Discarded packets |
| A | 0 | 173435 | 0 |
| B | 0 | 248112 | 0 |
| C | 0 | 117500 | 0 |
| D | 0 | 139843 | 0 |
| Quadrant | Total seconds | Saturated seconds | Saturation percentage |
|---|---|---|---|
| A | 53893 | 1393 | 2.584751% |
| B | 53860 | 12174 | 22.603045% |
| C | 53894 | 727 | 1.348944% |
| D | 53883 | 1991 | 3.695043% |
Noise dominated data is calculated using 1-second bins in cleaned event files. If a bin has >2000 counts, and if more than 50% of those come from <1% of pixels, then it is considered to be noise-dominated and hence unusable.
| Quadrant | # 1 sec bins | Bins with >0 counts | Bins with >2000 counts | High rate bins dominated by noise | Noise dominated (total time) | Noise dominated (detector-on time) | Marked lightcurve |
|---|---|---|---|---|---|---|---|
| A | 73117 | 53912 | 0 | 0 | 0.00% | 0.00% |  |
| B | 73118 | 53881 | 0 | 0 | 0.00% | 0.00% |  |
| C | 73118 | 53884 | 0 | 0 | 0.00% | 0.00% | 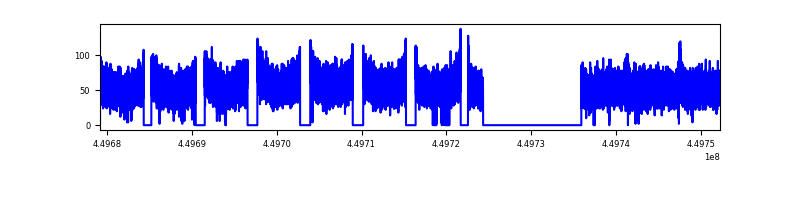 |
| D | 73118 | 53871 | 0 | 0 | 0.00% | 0.00% |  |
Top three noisy pixels from each quadrant. If the there are fewer than three noisy pixels in the level2.evt file, extra rows are filled as -1
| Pixel properties | Quadrant properties | ||||||
|---|---|---|---|---|---|---|---|
| Quadrant | DetID | PixID | Counts | Sigma | Mean | Median | Sigma |
| A | 7 | 110 | 2282 | 8.28 | 744 | 692 | 192.0 |
| A | 15 | 236 | 2278 | 8.26 | 744 | 692 | 192.0 |
| A | 0 | 29 | 2179 | 7.75 | 744 | 692 | 192.0 |
| B | 2 | 9 | 2373 | 12.76 | 671 | 635 | 136.2 |
| B | 2 | 8 | 1870 | 9.07 | 671 | 635 | 136.2 |
| B | 3 | 17 | 1709 | 7.89 | 671 | 635 | 136.2 |
| C | 1 | 81 | 2247 | 7.57 | 775 | 722 | 201.5 |
| C | 3 | 202 | 2225 | 7.46 | 775 | 722 | 201.5 |
| C | 1 | 80 | 2140 | 7.04 | 775 | 722 | 201.5 |
| D | 4 | 250 | 1923 | 6.37 | 715 | 648 | 199.9 |
| D | 10 | 189 | 1857 | 6.04 | 715 | 648 | 199.9 |
| D | 7 | 3 | 1838 | 5.95 | 715 | 648 | 199.9 |
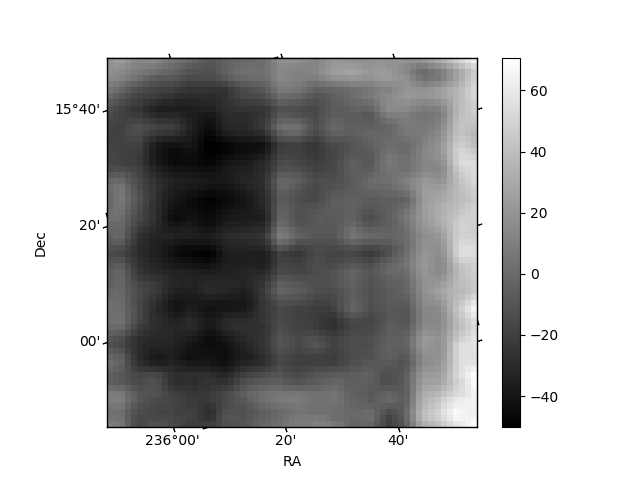
Histogram calculated using DETX and DETY for each event in the final _common_clean file
| Quadrant A |  |
 |
Quadrant B |
|---|---|---|---|
| Quadrant D | 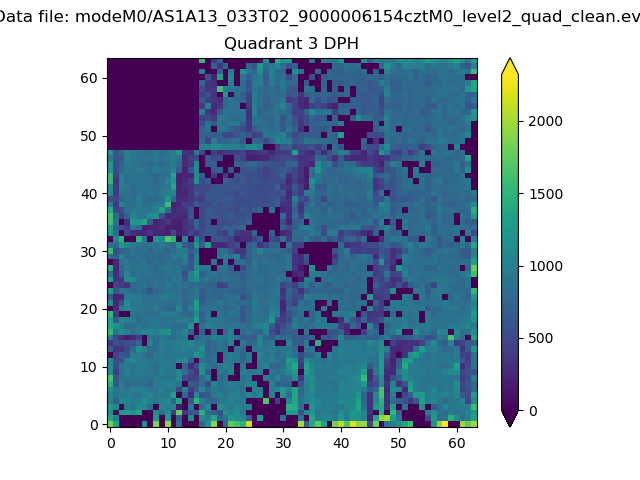 |
 |
Quadrant C |
| Plot type | Count rate plots | Images |
|---|---|---|
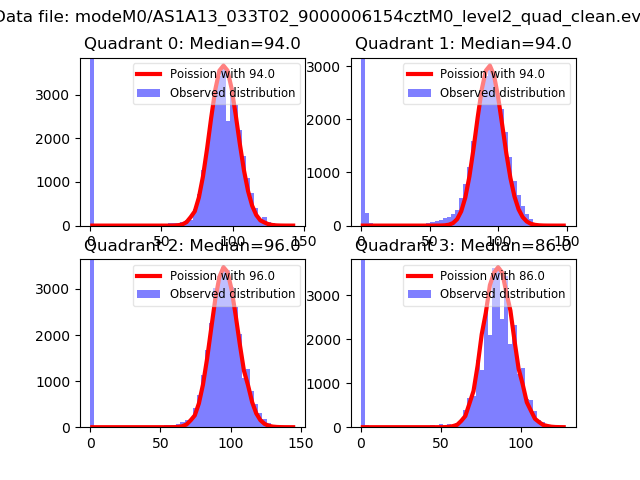
| Comparison with Poisson distribution Blue bars denote a histogram of data divided into 1 sec bins. Red curve is a Poisson curve with rate = median count rate of data. |
 |
 |
| Quadrant-wise count rates Data is divided into 100 sec bins |
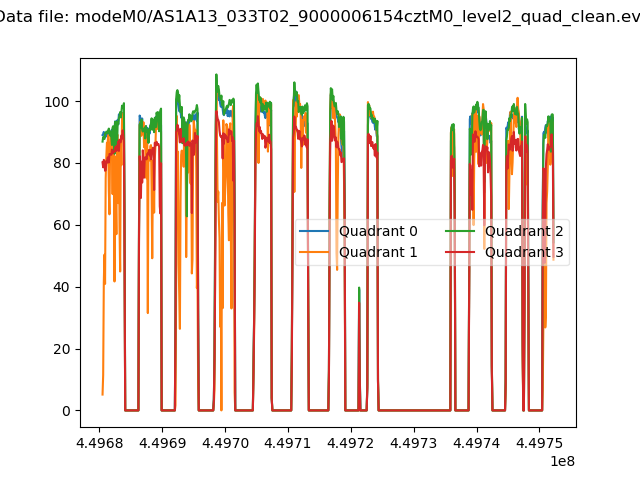 |
|
| Module-wise count rates for Quadrant A Data is divided into 100 sec bins |
 |
 |
| Module-wise count rates for Quadrant B Data is divided into 100 sec bins |
 |
 |
| Module-wise count rates for Quadrant C Data is divided into 100 sec bins |
 |
 |
| Module-wise count rates for Quadrant D Data is divided into 100 sec bins |
 |
 |
| Parameter | Plot |
|---|---|
| CZT HV Monitor |  |
| D_VDD |  |
| Temperature 1 |  |
| Veto HV Monitor | 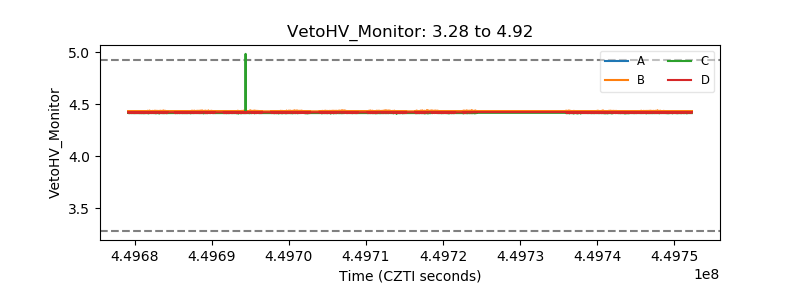 |
| Veto LLD |  |
| Alpha Counter |  |
| _CPM_Rate | 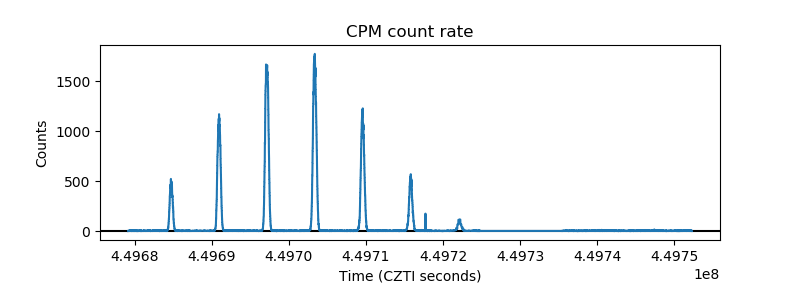 |
| CZT Counter |  |
| +2.5 Volts monitor | 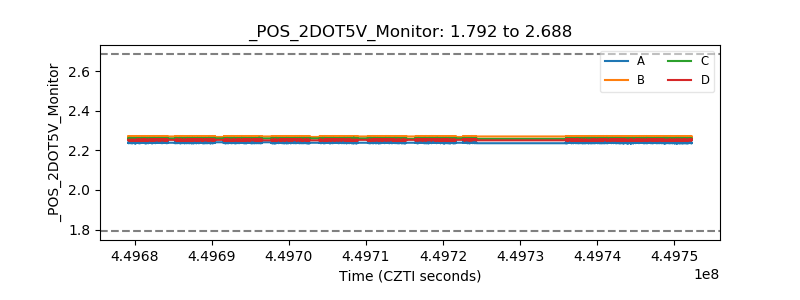 |
| +5 Volts monitor | 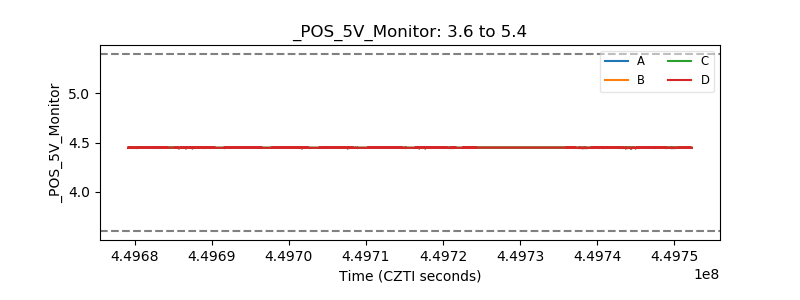 |
| _ROLL_ROT |  |
| _Roll_DEC |  |
| _Roll_RA |  |
| Veto Counter | 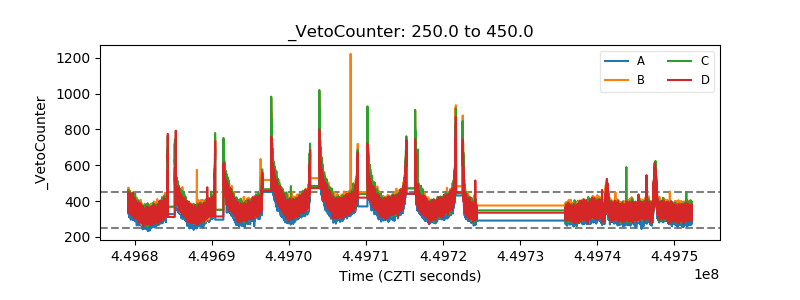 |