| Param | Original file | Final file |
|---|---|---|
| Filename | modeM0/AS1A13_033T01_9000006152cztM0_level2.fits | modeM0/AS1A13_033T01_9000006152cztM0_level2_quad_clean.evt |
| Size (bytes) | 559,889,280 | 564,281,280 |
| Size | 534.0 MB | 538.1 MB |
| Events in quadrant A | 3,344,624 | 3,411,464 |
| Events in quadrant B | 2,935,621 | 2,817,933 |
| Events in quadrant C | 3,399,073 | 3,420,340 |
| Events in quadrant D | 2,932,559 | 3,103,972 |
| Mode M0 | |||
|---|---|---|---|
| Quadrant | BADHDUFLAG | Total packets | Discarded packets |
| A | 0 | 202813 | 0 |
| B | 0 | 297149 | 0 |
| C | 0 | 144333 | 0 |
| D | 0 | 156264 | 0 |
| Mode M9 | |||
|---|---|---|---|
| Quadrant | BADHDUFLAG | Total packets | Discarded packets |
| A | 0 | 72 | 0 |
| B | 0 | 72 | 0 |
| C | 0 | 72 | 0 |
| D | 0 | 72 | 0 |
| Mode SS | |||
|---|---|---|---|
| Quadrant | BADHDUFLAG | Total packets | Discarded packets |
| A | 0 | 1280 | 0 |
| B | 0 | 1278 | 0 |
| C | 0 | 1284 | 0 |
| D | 0 | 1022 | 0 |
| Quadrant | Total seconds | Saturated seconds | Saturation percentage |
|---|---|---|---|
| A | 63351 | 1692 | 2.670834% |
| B | 63298 | 16370 | 25.861797% |
| C | 63447 | 1799 | 2.835437% |
| D | 63523 | 1631 | 2.567574% |
Noise dominated data is calculated using 1-second bins in cleaned event files. If a bin has >2000 counts, and if more than 50% of those come from <1% of pixels, then it is considered to be noise-dominated and hence unusable.
| Quadrant | # 1 sec bins | Bins with >0 counts | Bins with >2000 counts | High rate bins dominated by noise | Noise dominated (total time) | Noise dominated (detector-on time) | Marked lightcurve |
|---|---|---|---|---|---|---|---|
| A | 72447 | 63423 | 0 | 0 | 0.00% | 0.00% |  |
| B | 72447 | 63340 | 0 | 0 | 0.00% | 0.00% |  |
| C | 72448 | 63378 | 0 | 0 | 0.00% | 0.00% |  |
| D | 72448 | 63557 | 0 | 0 | 0.00% | 0.00% | 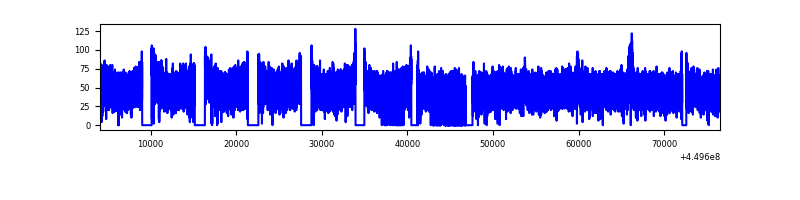 |
Top three noisy pixels from each quadrant. If the there are fewer than three noisy pixels in the level2.evt file, extra rows are filled as -1
| Pixel properties | Quadrant properties | ||||||
|---|---|---|---|---|---|---|---|
| Quadrant | DetID | PixID | Counts | Sigma | Mean | Median | Sigma |
| A | 0 | 29 | 2702 | 8.39 | 870 | 809 | 225.5 |
| A | 15 | 236 | 2681 | 8.3 | 870 | 809 | 225.5 |
| A | 7 | 110 | 2673 | 8.26 | 870 | 809 | 225.5 |
| B | 2 | 9 | 2622 | 11.8 | 773 | 729 | 160.4 |
| B | 2 | 8 | 2099 | 8.54 | 773 | 729 | 160.4 |
| B | 5 | 232 | 2003 | 7.94 | 773 | 729 | 160.4 |
| C | 3 | 203 | 2553 | 7.43 | 897 | 834 | 231.4 |
| C | 3 | 202 | 2519 | 7.28 | 897 | 834 | 231.4 |
| C | 1 | 81 | 2519 | 7.28 | 897 | 834 | 231.4 |
| D | 4 | 250 | 2183 | 6.13 | 840 | 762 | 231.7 |
| D | 12 | 6 | 2140 | 5.94 | 840 | 762 | 231.7 |
| D | 10 | 189 | 2109 | 5.81 | 840 | 762 | 231.7 |
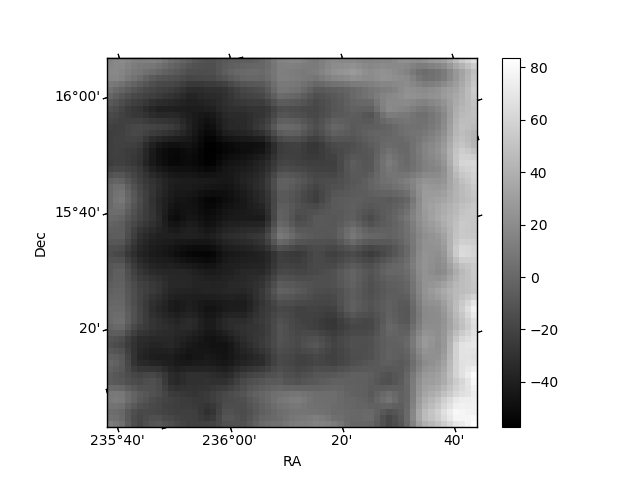
Histogram calculated using DETX and DETY for each event in the final _common_clean file
| Quadrant A |  |
 |
Quadrant B |
|---|---|---|---|
| Quadrant D |  |
 |
Quadrant C |
| Plot type | Count rate plots | Images |
|---|---|---|
| Comparison with Poisson distribution Blue bars denote a histogram of data divided into 1 sec bins. Red curve is a Poisson curve with rate = median count rate of data. |
 |
 |
| Quadrant-wise count rates Data is divided into 100 sec bins |
 |
|
| Module-wise count rates for Quadrant A Data is divided into 100 sec bins |
 |
 |
| Module-wise count rates for Quadrant B Data is divided into 100 sec bins |
 |
 |
| Module-wise count rates for Quadrant C Data is divided into 100 sec bins |
 |
 |
| Module-wise count rates for Quadrant D Data is divided into 100 sec bins |
 |
 |
| Parameter | Plot |
|---|---|
| CZT HV Monitor |  |
| D_VDD |  |
| Temperature 1 |  |
| Veto HV Monitor |  |
| Veto LLD | 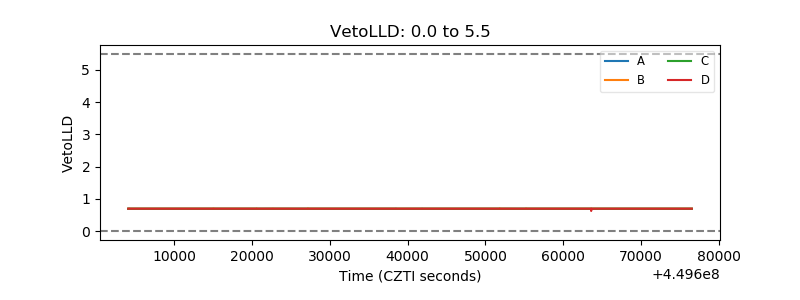 |
| Alpha Counter |  |
| _CPM_Rate |  |
| CZT Counter |  |
| +2.5 Volts monitor |  |
| +5 Volts monitor |  |
| _ROLL_ROT |  |
| _Roll_DEC |  |
| _Roll_RA |  |
| Veto Counter |  |